


Most tutoring centers don't have a KPI problem. They have a plumbing problem.
The owner asks a simple question — "What's our real retention rate this quarter?" — and three people give three different answers. The scheduler pulls one number from the booking calendar. The bookkeeper counts active families in the payment system. Someone in the front office has a spreadsheet that's been manually updated since 2022. Nobody's wrong, exactly. They're just measuring different things off different sources, and none of those sources agree on what a "student" even is.
That's the core issue with tutoring data architecture. The data exists — it's scattered across your scheduling tool, your payment processor, your assessment forms, and half a dozen spreadsheets. The problem is that none of it connects cleanly, so any KPI you build on top of it inherits every inconsistency underneath.
This article walks through how to structure that foundation: a canonical data model, the order you should connect systems in, and how to sequence your data pipelines so you get reliable numbers fast instead of spending six months building a warehouse nobody trusts.
Start with the entities, not the reports
The instinct most owners have is to start from the dashboard they want. "I want to see revenue per tutor." Fine — but revenue per tutor depends on how you define a session, how you attribute a family's payment across multiple kids, and whether a canceled-but-billed session counts. If those definitions are fuzzy, the report will be fuzzy no matter how nice it looks.
So you start with the entities. In a tutoring operation, there are really only a handful that matter, and almost every KPI you'll ever want is some combination of them.
The canonical entities:
-
Family — the billing and relationship unit. One family can have multiple students. This is usually your account.
-
Student — the learner. Belongs to exactly one family. Has a grade, subjects, and a status (active, paused, churned).
-
Tutor — the staff member delivering sessions. Has a pay rate, subjects they cover, and a location if you're multi-site.
-
Session — a single delivered (or scheduled) block of tutoring. This is your most important table. It links a student, a tutor, a time, a subject, a status, and eventually an outcome.
-
Invoice — a billing document tied to a family, covering one or more sessions or a package/subscription period.
-
Payment — money actually received, applied against one or more invoices.
-
Enrollment / Package — the agreement that governs how sessions get consumed and billed (X sessions/month, drop-in, subscription, etc.).
Notice that a session is separate from an invoice, and an invoice is separate from a payment. This trips people up constantly. It usually happens when someone treats "billed" and "paid" as the same field — then a family who's three weeks late still shows up as current revenue, and your cash KPIs quietly drift from reality.
The relationships that matter most:
-
A Family has many Students
-
A Student has many Sessions
-
A Tutor has many Sessions
-
A Session rolls up to an Invoice (or a subscription period)
-
An Invoice gets settled by one or more Payments
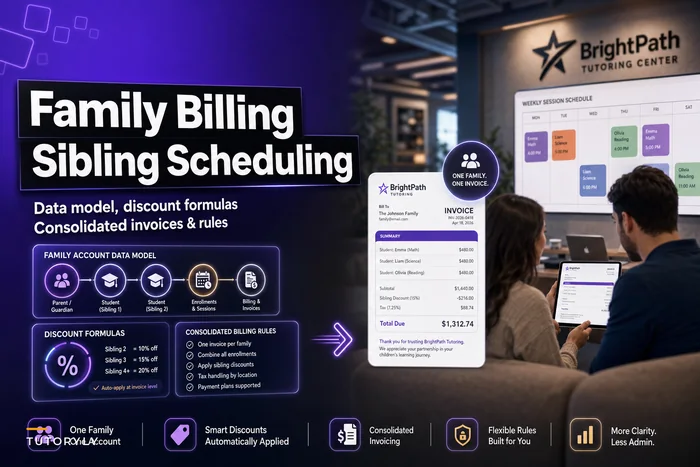
If you can draw that cleanly, you're already ahead of most centers. The family-to-student split in particular is where a lot of billing logic lives, and we've written more about that structure in sibling scheduling and consolidated billing if you're wrestling with multi-kid households.
The one field that quietly wrecks everything: status
Before getting to schema, a quick warning about the most abused column in tutoring data: status.
Never miss another tutoring session.
Tutoryly helps you schedule, confirm, and manage every tutoring session efficiently.
- Unified session scheduling
- Automated student notifications
- Tutor calendar & availability management
No credit card required
Every entity has a status, and every status gets overloaded until it means nothing. "Active" ends up describing a student who hasn't booked in seven weeks but hasn't formally quit. "Completed" gets used for both a session that happened and a session that was canceled-but-charged. A tutor marked "inactive" still has open sessions on the calendar.
The pattern to avoid: using a single status field to carry two different ideas. A session has a scheduling state (scheduled, completed, canceled, no-show) and a billing state (billable, billed, waived, comped). Those are two separate axes. If you cram them into one column, you can never cleanly answer "how many sessions did we deliver" versus "how many did we get paid for" — and that gap is exactly where revenue leaks hide.
Keep them separate. One extra column, a hundred fewer reconciliation headaches.
Sample schema mappings
Here's a stripped-down version of what the core tables look like. You don't need this to be fancy — you need it to be consistent.
Session table (the heart of everything):
| Field | Type | Notes |
|---|---|---|
| session_id | ID | Primary key |
| student_id | ID | Links to student |
| tutor_id | ID | Links to tutor |
| subject | string | Normalized list, not free text |
| scheduled_start | datetime | |
| duration_min | int | |
| schedule_status | enum | scheduled / completed / canceled / no-show |
| billing_status | enum | billable / billed / waived / comped |
| location_id | ID | Null if single-site |
| enrollment_id | ID | Which package this draws from |
Invoice table:
| Field | Type | Notes |
|---|---|---|
| invoice_id | ID | Primary key |
| family_id | ID | Billing unit, not student |
| periodstart / periodend | date | For subscriptions |
| amount_total | decimal | |
| amount_paid | decimal | Derived from payments |
| status | enum | draft / sent / partial / paid / overdue |
The most common mapping mistake when centers pull from different vendors: the scheduling tool keys everything on student, and the payment tool keys everything on family (or worse, on an email address). When you try to join them, you get orphaned sessions with no invoice and invoices that can't be traced back to specific sessions. Decide early that familyid is the billing key and studentid is the delivery key, and make every import respect that.
One more thing: normalize your subject list. "Math," "Mathematics," "Algebra," and "HS Math" as free text will destroy any subject-level KPI you try to build. Pick a controlled list and force everything into it on the way in.
The integration-priority matrix: what to connect first
You can't integrate everything at once, and you shouldn't try. Some data sources give you reliable KPIs almost immediately; others take weeks of cleanup for marginal payoff. The trick is sequencing by value-to-effort, not by whatever's easiest to export.
Here's the priority matrix for a small center starting from scattered tools:
| Source | KPI Value | Integration Effort | Priority |
|---|---|---|---|
| Scheduling / calendar | High | Low–Medium | 1 — do first |
| Payment processor | High | Medium | 2 |
| Family/student CRM or intake | Medium | Low | 3 |
| Assessment / progress data | High | High | 4 — worth it, but harder |
| Tutor time & payroll | Medium | Medium | 5 |
| Marketing / lead source | Medium | High | 6 |
| Feedback / NPS | Low–Medium | Low | 7 |
Why scheduling comes first: sessions are the atomic unit of a tutoring business. Once you have clean session data, you can immediately compute utilization, delivery volume, cancellation rates, and tutor load — without touching money at all. Fastest path to a trustworthy number.
Why payment is second, not first: money data feels like the priority, but it's meaningless until you can tie payments back to sessions and families. Connect scheduling, then layer payment on top so revenue lines up with delivered work.
Why assessment data is worth the pain: it's the hardest to integrate because it usually lives in unstructured notes and forms, but it's what connects sessions to actual outcomes. If you can eventually tie a student's session history to their progress, you unlock your most powerful retention signals. We go deeper on that link in why a progress-tracking system that ties sessions to outcomes becomes your retention engine.
The mistake is chasing the "cool" dashboard — outcome analytics, lead attribution — before the boring foundation is solid. A gorgeous retention chart built on inconsistent session data is worse than no chart, because people trust it and make decisions off it.
ETL sequencing: the order that actually produces trustworthy numbers
ETL means Extract (pull data out of your tools), Transform (clean and standardize it), and Load (put it somewhere you can report on). For a small center, this doesn't require a data engineering team — it requires discipline about order.
-
Extract and stabilize your entity keys first. Before anything else, get a clean list of families, students, and tutors with stable IDs. Everything else joins to these. If a student exists under two different IDs in two systems, fix that now — it poisons every downstream number.
-
Load sessions and reconcile them against the calendar. Pull every session, apply your schedulestatus and billingstatus separately, and spot-check a week against reality. If your data says 40 sessions happened last Tuesday and the room only holds 12 chairs, you've found a duplication bug early.
-
Layer payments and reconcile against invoices. Now bring in money. Match payments to invoices, invoices to sessions and enrollments. Your target: does total revenue in your model match your actual bank deposits within a small margin? If it doesn't, don't build KPIs yet.
-
Derive the core KPIs. Only after the above three are stable do you compute retention, utilization, revenue per tutor, and average revenue per family. Because they're built on reconciled data, they'll survive scrutiny.
-
Add outcome and secondary data last. Assessment progress, lead source, feedback — these enrich the picture but shouldn't gate your first reliable dashboards.
The reason this order matters: KPIs built on unreconciled data don't just fail once. They fail quietly, forever, and you don't find out until a decision based on them goes wrong. Reconciliation at each step is what makes the eventual numbers trustworthy instead of merely available.
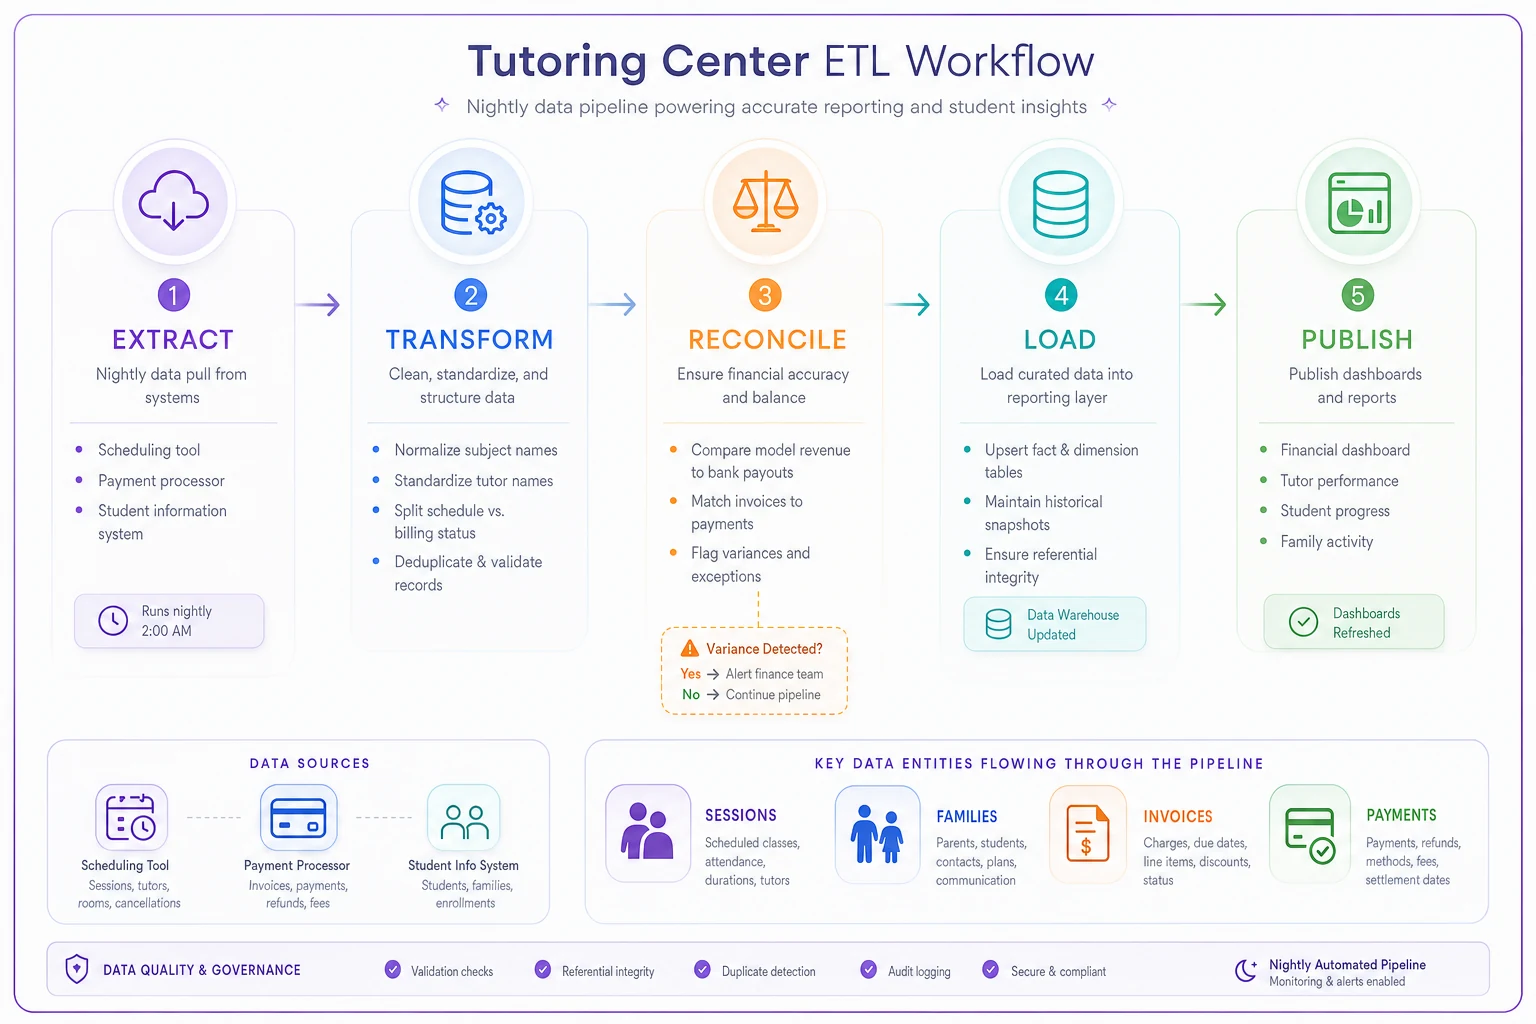
Here's a quick workflow example of how this runs in practice: sessions get extracted nightly, transformed to normalize subjects and split status fields, and loaded into a reporting layer. Payments get extracted on the same cadence and matched to families by the shared family_id. A reconciliation check compares model revenue to processor payouts and flags anything off by more than a set threshold. If the flag stays clean for a couple of weeks, the foundation holds — and only then do you publish the dashboard to the whole team.
A real scenario: two locations, three sources of truth
A center with two locations — roughly 120 active students total — was running scheduling in one tool, billing through a separate payment processor, and tracking "who's actually still enrolled" in a shared spreadsheet.
The symptom: the owner believed monthly retention was around 90%. But cash didn't match the story. Revenue kept dipping in months where retention supposedly held steady.
When they rebuilt the data around a canonical model, the gap became obvious. The spreadsheet counted a family as "active" until someone manually removed them, which happened late and inconsistently. The payment data told the truth — families were pausing subscriptions weeks before anyone updated the sheet. Real retention was closer to 78–80%, and the "missing" revenue was churn nobody had recorded yet.
Nothing about the business changed overnight. But once the session, family, and payment data reconciled, the owner could see churn about three weeks earlier than before — early enough to actually call a family before they were gone. Over the following couple of quarters, catching those at-risk families sooner recovered a meaningful chunk of what had been silently leaking. The number didn't get better because they worked harder. It got true, and true numbers let them act in time.
When this level of structure makes sense (and when it doesn't)
Not every tutoring operation needs a formal data architecture on day one.
When it makes sense:
-
You have more than one location, or more than a handful of tutors
-
Your KPIs disagree depending on who you ask
-
You're making hiring, pricing, or capacity decisions off numbers you're not fully confident in
-
Billing and scheduling live in separate systems that don't talk
When it's overkill:
-
You're a solo tutor with fewer than 20 or so students and one calendar. A single clean spreadsheet genuinely covers you.
-
You're pre-launch and don't have real data yet. Design the entities, sure, but don't build pipelines for data that doesn't exist.
Who should hold off for now: owners who haven't standardized their basic operational workflow yet. If intake, scheduling, delivery, and billing aren't a repeatable process, data architecture will just capture the chaos faithfully. Get the operational flow consistent first — we mapped that end to end in the tutoring center operations system — then build the data layer on top of a process that already works.
Choosing tools without over-buying
Vendor selection is where a lot of centers overspend or lock themselves into something rigid. A few practical filters:
-
Does it export clean data? Any tool you rely on must let you get your data out — via API or at minimum a structured CSV with stable IDs. A scheduling tool that only exports a printable PDF is a dead end for KPIs.
-
Does it separate family and student? If a payment tool can't distinguish a family from an individual student, consolidated billing and per-family KPIs get painful fast.
-
Does it let status carry two axes, or force everything into one? Tools that only offer a single session status field will make your delivery-vs-billing reconciliation harder.
-
Can it grow with a second location? Single-site-only tools become the reason you eventually rip everything out.
You don't need an all-in-one platform to start. You need each tool to export cleanly and share consistent keys, so they can be joined in a reporting layer. Platforms that combine scheduling, billing, and reporting under one data model do save you the integration step — that's the real operational argument for them — but the deciding factor is always whether the underlying data stays clean and connected, not how many features are on the marketing page.
Prioritize tools that provide stable IDs and an API—export-friendly tools save weeks of manual work later.
The centers that get reliable KPIs fastest aren't the ones with the most software. They're the ones who decided early what a session, a family, and a payment mean — and refused to let those definitions drift.
The takeaway
Trustworthy KPIs aren't a reporting feature you switch on. They're the output of a clean data model, integrated in the right order, reconciled at every step. Get the entities right, keep scheduling status and billing status separate, connect scheduling before money and money before outcomes, and reconcile against reality before you publish anything.
Do that, and the next time someone asks "what's our real retention rate," you'll have one answer — and you'll be able to stand behind it.
Ready to streamline your tutoring operations?
Join 500+ tutors and centers using Tutoryly to save time, improve scheduling accuracy, and enhance student experiences.