



Most tutoring centers already collect a mountain of information. Session notes get written. Assessments get scored. Progress reports go out. But almost none of it connects. The notes live in one tutor's Google Doc, the rubric scores live in a spreadsheet nobody opens, and the benchmark results sit in a folder until a parent asks how their kid is doing.
That disconnection is the whole problem. You're sitting on the exact data that predicts whether a family renews or walks — and you can't see it because none of it talks to each other.
A real tutoring progress tracking system isn't a fancier notes template. It's the plumbing that links what happens inside a session to the outcomes families care about, and then links those outcomes to your retention and revenue numbers. When that chain is intact, you stop guessing which students are at risk. You can see it three weeks out.
This post walks through how the pieces connect, where they typically break, and what changes when you build the system properly instead of bolting on another form.
The chain nobody builds: session → outcome → renewal
The mental model most centers are missing is pretty simple. Every renewal decision a parent makes is really a judgment about momentum. Not the final grade, not the SAT score six months away — momentum right now. Is my kid getting better, and can I actually see it?
The data that answers that question already exists in your operation. It's just scattered across four layers:
-
Session-level notes — what happened today, what the student struggled with, what got assigned
-
Rubric scores — a consistent way to rate skill or mastery on the same scale every session
-
Benchmark assessments — periodic checkpoints that measure real progress against a baseline
-
Business KPIs — retention rate, renewal timing, lifetime value, revenue per student
When these four layers are connected, you get a signal. When they're not, you get four separate piles of paper that each look fine on their own and tell you nothing together.
The pattern that keeps showing up: a center has solid session notes and a decent assessment process and a churn problem they can't explain. All the ingredients, no recipe. The kid whose rubric scores flatlined for five weeks was invisible until the cancellation email arrived.
Why this breaks in almost every center
It's not laziness. The disconnection happens for structural reasons that get worse as you grow.
Never miss another tutoring session.
Tutoryly helps you schedule, confirm, and manage every tutoring session efficiently.
- Unified session scheduling
- Automated student notifications
- Tutor calendar & availability management
No credit card required
Notes and scores use different languages. A tutor writes "Maya struggled with word problems today, better on fractions." That's a sentence, not data. There's no way to compare it to last week or roll it up across 40 students. Rubrics fix this — but only if every tutor uses the same rubric the same way, which almost never happens without some enforcement.
Benchmarks happen too rarely to catch problems early. A lot of centers benchmark at intake and then again "when it feels right." By the time the second benchmark confirms a student stalled, they've already had six weak sessions and the parent has already started shopping around.
Nobody owns the connection. Tutors own the sessions. The front desk owns billing and renewals. The owner owns the P&L. The link between "this student's scores are sliding" and "this family is a renewal risk" falls into the gap between all three roles. Nobody's actual job is to watch it.
At a two-tutor operation, the owner can hold all of this in their head. They know Maya's mom is nervous because they see Maya every week. That intuition is a real system — it just doesn't scale. Cross 60 or 70 active students and three or four tutors, and the owner's mental model breaks. The signal is still in the data somewhere, but no human is holding it anymore, and nothing has replaced them.
What a connected system actually looks like
The goal is to make progress legible — to you, to your tutors, and eventually to parents — using the same measurements consistently over time. Here's the structure that holds up.
Rubrics that produce comparable numbers
A rubric only works if it turns fuzzy judgment into a repeatable score. Keep it simple. A 1–4 scale per skill dimension is plenty. The trap is building a 12-category rubric that tutors resent and fill out inconsistently. Fewer dimensions, scored honestly every session, beats a comprehensive rubric scored twice a month.
Here's a workable skeleton for a math tutoring rubric:
| Dimension | 1 – Emerging | 2 – Developing | 3 – Proficient | 4 – Independent |
|---|---|---|---|---|
| Concept understanding | Needs full re-teach | Grasps with heavy support | Grasps with light prompts | Explains it back |
| Procedural accuracy | Frequent errors | Some errors, self-corrects rarely | Mostly accurate | Consistently accurate |
| Independence | Can't start alone | Starts with prompting | Works mostly alone | Fully independent |
| Retention from last session | Forgot prior material | Partial recall | Solid recall | Applies prior material |
The magic isn't the wording — it's that every tutor scores the same four things every session. Now "Maya struggled with word problems" becomes Concept: 2, Procedural: 2, Independence: 1 — and next week you can see whether those numbers moved.
Benchmarks on a fixed cadence
Benchmarks are your ground truth. Rubric scores are subjective per tutor; benchmarks are standardized checkpoints that verify the session-level trend is real. Run them on a schedule, not on instinct:
-
Baseline at intake (you're already doing this)
-
Every 6–8 sessions for an active student
-
Before any renewal conversation, so you walk in with proof
The cadence matters more than the content. A mediocre assessment run consistently gives you a trend line. A perfect assessment run randomly gives you noise.
The rollup that turns notes into signals
This is the layer that makes everything else worth doing. You need to aggregate rubric scores across sessions and flag movement. The three states that matter:
-
Climbing — scores trending up, momentum is visible → renewal-safe, use in progress reports
-
Flat — scores stuck across 4+ sessions → early warning, intervene now
-
Sliding — scores dropping → high churn risk, escalate immediately
A student sitting at "flat" for a month is your at-risk list. That's the whole point of the system — to surface that list automatically instead of discovering it in a cancellation email.
This diagram shows how session notes flow to rubrics, benchmarks, rollup, and revenue.
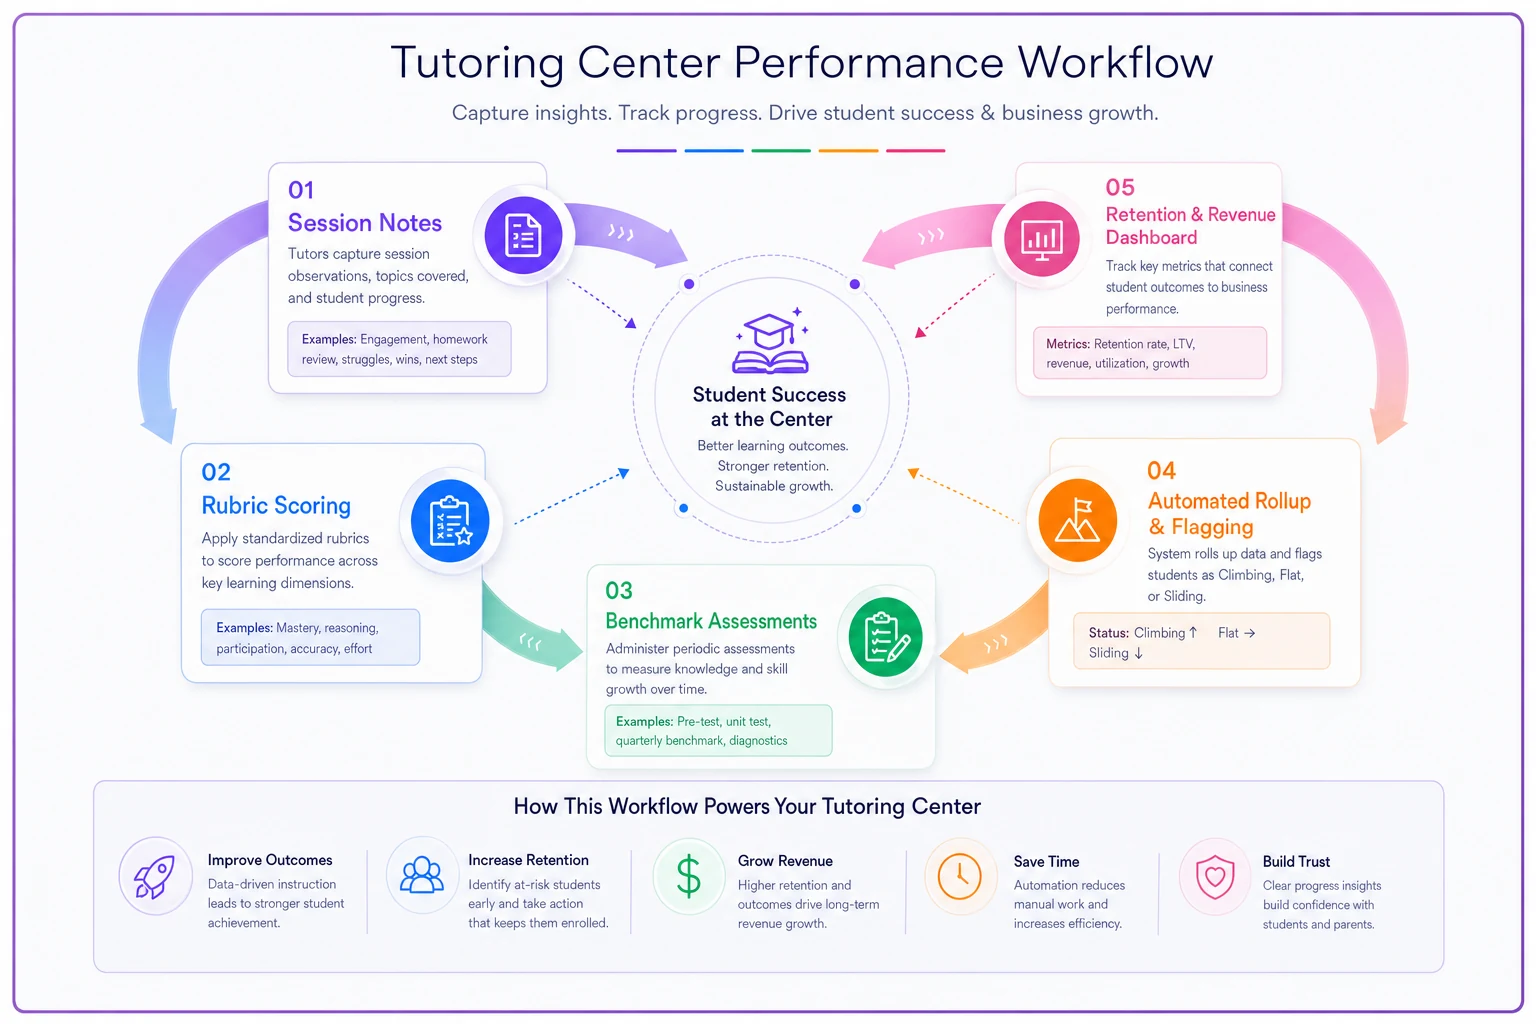
Putting that rollup in place is the step that turns disparate data into a weekly signal you can act on.
The retention-revenue link most owners never draw
Once rubric and benchmark data are structured, you can correlate them against your actual retention outcomes. What tends to show up consistently across operations that do this well: students whose rubric scores climb in their first 8 sessions renew at dramatically higher rates than students who stay flat. The exact numbers vary, but the direction never does.
That gives you a predictive lever instead of a lagging report. Instead of measuring churn after it happens, you're watching the leading indicator — score momentum — and acting on it while the family is still enrolled.
A few KPIs worth tracking once the data connects:
| KPI | What it tells you | Why it matters |
|---|---|---|
| % of students "climbing" at session 8 | Early momentum health | Strongest renewal predictor you have |
| Avg. sessions to first score improvement | How fast you create visible progress | Slow improvement = higher early churn |
| Renewal rate by momentum state | Climbing vs flat vs sliding | Quantifies what stalled progress costs you |
| Revenue at risk (flat + sliding students × avg. package value) | Dollar figure on your at-risk list | Turns a soft worry into a number |
That last row is the one that gets owners to actually build this. When your at-risk list has a dollar figure attached — "we've got roughly $9k–$12k in packages sitting in the flat/sliding column right now" — the abstract idea of "tracking progress" suddenly has teeth.
Sample queries to pull the signals
If your data lives somewhere queryable — a database, a structured spreadsheet, or a platform that lets you filter — these are the pulls that earn their keep. Written loosely so you can adapt them:
Find flat students (early warning list):
> Return every active student whose average rubric score across their last 4 sessions changed by less than 0.3 points versus the prior 4 sessions.
Renewal rate by momentum state:
> Group students by their momentum state (climbing / flat / sliding) at the point of their renewal decision, and calculate the renewal rate for each group.
Revenue at risk right now:
> Sum the remaining package value of all active students currently flagged flat or sliding.
Tutor consistency check:
> Compare average rubric scores by tutor against benchmark results for the same students, to catch tutors who are scoring too generously or too harshly.
That last query is quietly important. Rubrics drift. One tutor scores everyone a 3, another scores the same performance a 2. Cross-checking rubric averages against standardized benchmarks keeps your data honest, which keeps every downstream decision honest.
A report template that does double duty
The report you build for internal tracking should be the same data you show parents. Don't maintain two versions. A simple monthly progress report structure:
-
Snapshot — current rubric scores across the 4 dimensions, shown as this-month vs last-month
-
Trend line — benchmark scores plotted from baseline to now
-
Momentum callout — one honest sentence
"Maya has moved from Developing to Proficient in procedural accuracy over the last month"
-
Next focus — the one or two things you're working on next
-
Recommendation — implicit or explicit renewal framing tied to the trajectory
When the internal signal and the parent report share a source, renewal conversations stop being sales pitches and become data reviews. You're not convincing anyone — you're showing them a line going up.
Where this actually pays off — a real scenario
A mid-sized center running about 70 active students had a churn problem they couldn't pin down. Retention was fine at intake and fine for long-term students, but they were bleeding families somewhere in the middle — roughly month two to month four. Nobody could say why, because the session notes were prose and assessments only ran at intake and "end of term."
They rebuilt around a 4-dimension rubric scored every session and a benchmark every 7 sessions. Within a couple months they had a flat/sliding list surfacing students before the parent got nervous. The front desk started every mid-term renewal conversation with a benchmark trend line instead of a "so, how's it going?" call.
It wasn't dramatic overnight. But over about two terms, mid-cycle churn dropped noticeably — renewal rates in that vulnerable month-two-to-four window climbed somewhere in the range of 12–15 points. On their student count and package pricing, that worked out to around $30k–$40k in retained annual revenue, mostly from families who used to quietly drift off and now had a visible reason to stay.
The tutoring didn't get magically better. The visibility did. They caught stalls early and acted on them.
When this makes sense — and when it doesn't
Build this if:
-
You have more than ~30 active students and can't hold every kid's progress in your head
-
You have multiple tutors and need consistency across them
-
Your churn shows up mid-cycle rather than at intake
-
Parents ask "is this working?" and you can't answer with data
Hold off if:
-
You're a solo tutor with a dozen students you know well — your intuition still outperforms any system at that size
-
You can't get tutors to fill out even basic notes yet — fix the notes habit first, then add scoring
-
You'd build the rubric but never do the rollup — a rubric with no aggregation is just extra paperwork that annoys your tutors for zero payoff
That last warning is the real killer. The most common way this fails isn't building a bad rubric — it's building a fine rubric and never connecting the scores to anything. Tutors fill out forms for months, nobody looks at the data, and the whole thing quietly dies. If you're not going to do the rollup and maintain an at-risk list, don't start.
Making the system hold at scale
The manual version of all this works until it doesn't. Aggregating rubric scores by hand, cross-checking tutors against benchmarks, recalculating your at-risk list every week — it's genuinely tedious, and tedious things get skipped exactly when you're busiest, which is exactly when you most need the signal.
This is where an operational platform that connects session logging, rubric scoring, and reporting in one place earns its cost. Not because software makes the pedagogy better, but because it handles the rollup automatically. The moment a tutor logs a session, momentum flags update, the at-risk list refreshes, and the parent report is already half-built. AI-assisted flagging can surface a sliding student the same day rather than three weeks later when someone finally opens the spreadsheet. The point isn't the technology — it's that the connection between sessions and outcomes stays live instead of depending on someone remembering to reconcile four data sources by hand.
Automate the rollup so weekly at-risk lists update without manual spreadsheets.
The center that keeps this chain intact — session to rubric to benchmark to renewal — stops treating retention as something that happens to them and starts treating it as something they can see coming and steer. That's the difference between reacting to cancellation emails and never letting things get that far.
Your session notes, rubrics, and benchmarks aren't three separate chores. They're one instrument, and the reading it gives you is momentum — the single thing that predicts whether a family stays or leaves.
Build the chain, keep it connected, and put a dollar figure on your at-risk list. Once you can see a stall three weeks before it becomes a cancellation, retention stops being luck and starts being an operation you actually run.
Ready to streamline your tutoring operations?
Join 500+ tutors and centers using Tutoryly to save time, improve scheduling accuracy, and enhance student experiences.