



Most small tutoring centers aren't short on data. They're drowning in it — attendance logs in one app, payment history in another, assessment scores in a spreadsheet someone updates when they remember, tutor notes scattered across email, text, and whatever that shared folder is called now. The problem isn't collection. It's that none of it lines up, so nobody trusts the numbers enough to make a real decision.
That's the gap this roadmap is built to close. Not by handing you another dashboard, but by walking through the actual maturity stages a center moves through — Instrument, Reconcile, Experiment — with who owns what, which tools make sense at each level, how you check your own work, and a 12-month timeline that fits a center running on 2–6 staff instead of a data team.
Framing this as maturity stages rather than a checklist matters because skipping ahead breaks things. Centers that try to run retention experiments before their attendance data is clean end up making confident decisions on garbage. The sequence matters more than the speed.
Why most centers get stuck between "reporting" and "deciding"
There's a pattern worth naming before getting into stages.
A center owner wants to know something practical — are our 1-on-1 students retaining better than small-group? They open three systems, pull three different numbers, and spend forty minutes reconciling in their head. Eventually they get a rough answer, trust it about 60%, and move on. Next month, same question, same forty minutes, slightly different answer because someone logged attendance differently.
What's actually happening is a maturity gap. The center has instrumentation (data is being captured somewhere) but no reconciliation (the numbers don't agree across systems), so they can never reach experimentation (testing changes and measuring the result cleanly). They're stuck producing reports they half-believe.
This isn't a tooling failure first. It's a definitions-and-ownership failure. Two tutors mean different things by "completed session." Nobody decided whether a no-show counts against utilization. The data architecture question comes later — and if you want the deeper build on that, the piece on tutoring data architecture to produce trustworthy KPIs quickly covers the structural side. This article is about the maturity path that sits on top of it.
The three stages, at a glance
The table below is the fastest way to orient yourself before diving in. Each stage has a different question it's trying to answer, a different owner, and a realistic timeframe — none of which should be rushed.
Never miss another tutoring session.
Tutoryly helps you schedule, confirm, and manage every tutoring session efficiently.
- Unified session scheduling
- Automated student notifications
- Tutor calendar & availability management
No credit card required
| Stage | Core question answered | What "done" looks like | Typical owner | Realistic duration |
|---|---|---|---|---|
| 1. Instrument | Are we capturing the right events, consistently? | Every session, payment, and assessment lands in a known place with agreed definitions | Center owner + lead tutor | Months 1–4 |
| 2. Reconcile | Do our numbers agree across systems? | One source of truth per KPI; discrepancies under a set tolerance | Ops lead / owner | Months 4–8 |
| 3. Experiment | Does a change actually improve outcomes? | You can run a small test and trust the before/after | Owner + tutor team | Months 8–12+ |
The durations overlap on purpose. You don't fully finish Instrument before touching Reconcile — you stabilize your core events, start reconciling those, then widen the net. The stages are a center of gravity, not hard walls.
Stage 1 — Instrument: capture the right things, the same way every time
The goal here is boring and essential: the same event, logged the same way, by every person, every time. Not more metrics. Fewer, cleaner ones.
Most centers at this stage are over-collecting and under-defining. They track twelve things loosely and can't trust any of them. The fix is to pick a small set of events that actually drive decisions and nail the definitions.
The events worth instrumenting first
-
Session completed — with a single, written definition (e.g., "tutor and student present for at least 80% of scheduled time")
-
No-show / late cancel — distinguished from each other, because they mean different things operationally
-
Assessment captured — baseline and periodic, with a consistent scoring scale
-
Payment event — charged, failed, recovered
-
Enrollment status change — trial, active, paused, churned
That's it to start. Five event types, tightly defined, beat twenty vague ones.
Deliverables for Stage 1
-
A one-page event dictionary — each event, its exact definition, who logs it, and when
-
A logging SOP every tutor reads and signs off on
-
A single intake point for each event type (even if it's still spread across tools, each event has one official home)
-
A weekly completeness check — did every scheduled session get a logged outcome?
Owner and QA
The owner or lead tutor owns the event dictionary. The QA check at this stage is completeness, not accuracy yet: every scheduled session on the calendar should have a matching logged outcome within 48 hours. If 90 sessions were scheduled and only 78 have outcomes logged, you have an instrumentation gap, not a performance problem.
Acceptance criteria for Stage 1: For two consecutive weeks, at least 95% of scheduled sessions have a logged outcome, and a random sample of 10 logs matches the written definitions without interpretation disputes.
A real tell that you're not done: hand your event dictionary to a new tutor and watch them log a week of sessions. If their numbers don't match what an experienced tutor would log, your definitions are still too loose.
The common Stage 1 mistake
Jumping to dashboards. A pretty dashboard built on inconsistent logging just makes bad data look authoritative. Dashboards are a Stage 2 reward, not a Stage 1 activity.
Stage 2 — Reconcile: make your systems agree
Now the harder part. You've got events landing consistently. Do they agree across the places they live?
This is where most centers quietly lose trust in their own reporting. Attendance in the scheduler says 340 sessions last month. Billing says you invoiced for 352. The assessment tracker shows 31 kids assessed but enrollment says 38 active students. Each number is defensible on its own. Together they don't add up, and that gap is exactly what makes an owner stop trusting the data.
What reconciliation actually means here
Reconcile doesn't mean every system holds identical data. It means for each KPI, you've decided which system is the source of truth, and the other systems fall within an agreed tolerance — or discrepancies get investigated.
The reconciliation workflow
-
Pick one KPI (start with sessions delivered — it touches scheduling, billing, and payroll)
-
Name the source of truth for that KPI
-
Pull the same period from every system that should reflect it
-
Line them up and record the gap
-
Set a tolerance and a rule for what happens when it's exceeded
-
Fix the root cause — usually a logging behavior, not a software bug
-
Re-run next period and confirm the gap shrank
Run that loop for your three or four most decision-relevant KPIs. Resist doing all of them. Sessions delivered, active enrollment, and revenue per active student will carry most of your decisions.
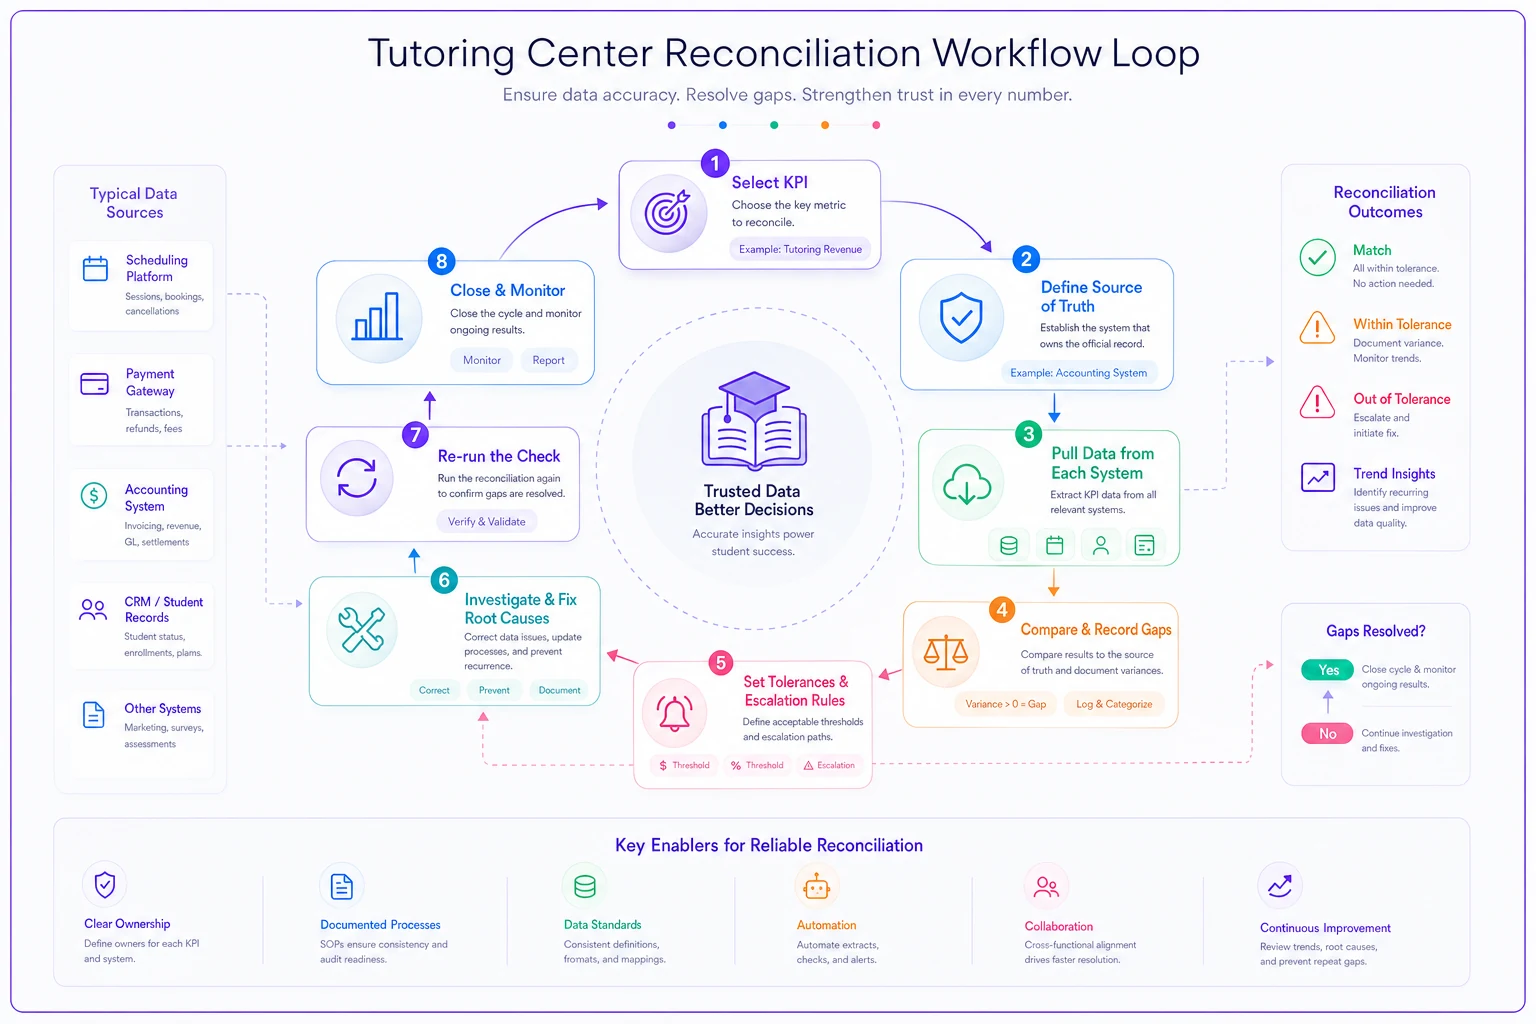
A simple visual of the loop helps teams run this consistently each month.
Start with sessions delivered — it touches scheduling, billing, and payroll, and surfaces most cross-system gaps.
Deliverables for Stage 2
-
A source-of-truth map
each KPI → one owning system
-
A monthly reconciliation worksheet showing each KPI across systems with the gap flagged
-
A tolerance table — acceptable gap per KPI and the escalation rule
-
A short root-cause log so recurring discrepancies get fixed, not re-discovered
Owner and QA
Ops lead or owner runs the monthly reconciliation. The QA check is the gap trend — are discrepancies shrinking month over month, or do the same mismatches keep reappearing? Recurring mismatches mean a logging behavior upstream never got fixed. That's an SOP problem, not a spreadsheet problem.
Acceptance criteria for Stage 2: Each core KPI has a named source of truth, three consecutive months of reconciliation worksheets, and all core KPIs within tolerance for at least two consecutive months.
This stage is also where the connection between your pedagogy numbers and your business numbers starts to matter. If you want to see how instructional metrics should tie back to revenue and retention, the measurement framework linking pedagogy to business outcomes in tutoring lays out that mapping — and reconciled data is the prerequisite for it to mean anything.
Where reconciliation quietly breaks at scale
With one location and two tutors, you can reconcile in your head. At four tutors and a second location, the discrepancies multiply — different people, different habits, different edge cases. A center that was fine on gut feel at 60 students starts producing contradictory numbers at 140, usually right when the owner has the least time to chase them down. Reconciliation is the stage that lets you grow past the point where one person can hold everything in their head.
Stage 3 — Experiment: test changes and trust the result
Only now does experimentation make sense. You've got clean, agreeing data, which means a before/after comparison actually reflects reality instead of logging noise.
Experimentation at a small center doesn't mean randomized control trials. It means: make one deliberate change, define what success looks like upfront, measure it against a clean baseline, and decide.
A worked example
-
Baseline Your reconciled 8-week retention for new students sits around 72%.
-
The change For new enrollments over two months, half get a structured mid-week check-in; half follow the normal cadence.
-
Group sizes Roughly 18 students in each group — small, but your data is clean enough to see a real difference.
-
Result Check-in group retains at about 81%, control around 73%.
-
Decision The gap is large enough and the groups comparable enough that you roll check-ins out to everyone — and you keep measuring to confirm it holds.
Notice what made this possible: a trustworthy baseline (Stage 2) and consistent event logging (Stage 1). Without those, an 81% vs 73% result could just be two tutors logging retention differently.
The experiment process
-
Write down the hypothesis in one sentence
-
Define the single metric that will decide it
-
Pull the reconciled baseline
-
Pick the smallest group that can show a meaningful difference
-
Run for a set window — don't peek and stop early
-
Compare against baseline and decide
adopt, drop, or re-run
-
Document it so you don't re-litigate the same question in six months
Deliverables for Stage 3
-
An experiment log — one row per test
hypothesis, metric, dates, result, decision
-
A baseline library — your current reconciled numbers for key outcomes, so every experiment has a reference point
-
A lightweight decision rule for what counts as "worth adopting"
Owner and QA
The owner sets the experiment agenda; tutors often run the day-to-day. QA here is discipline, not statistics — did we define success before starting, did we avoid stopping early because we liked an early number, did we compare against the real baseline? Small centers don't need p-values. They need honesty about not moving the goalposts mid-experiment. The deeper version of running valid small-sample tests connects naturally to how you've mapped your student journey — the piece on mapping a tutoring customer lifecycle into measurable funnels shows where in the lifecycle these experiments tend to pay off most.
Acceptance criteria for Stage 3: At least two completed experiments with pre-defined success metrics, documented decisions, and results measured against a reconciled baseline.
Tooling: match the tool to the stage, not the hype
The tool decision is where centers burn money by buying ahead of their maturity. Here's the honest breakdown.
| Stage | What you actually need | What NOT to buy yet |
|---|---|---|
| Instrument | Consistent logging — often your existing scheduler + a disciplined spreadsheet | A full BI/analytics suite |
| Reconcile | A way to pull the same period from each system and compare | A custom data warehouse |
| Experiment | A clean baseline store and a simple experiment log | Advanced statistical software |
Buy the tool after the behavior is stable, not before. A center that buys a reporting platform during Instrument just automates the chaos.
Where a connected operations platform earns its place is in the Reconcile stage. When your scheduling, attendance, billing, and notes live in one system, reconciliation stops being a monthly chore and becomes something closer to automatic — the event is logged once and reflected everywhere, so the gaps you'd normally chase don't appear in the first place. That's the real value of consolidating tools: not flashier dashboards, but fewer places for the same number to disagree with itself. It's a reason to consolidate, not a reason to skip the discipline underneath.
When this roadmap makes sense — and when it doesn't
When this roadmap makes sense — and when it doesn't
When it makes sense:
-
You're past the "one person remembers everything" size (roughly 50+ active students)
-
You've made at least one decision you later regretted because the data was off
-
You're planning to add staff or a location and can't afford to carry fuzzy numbers into a bigger operation
When it's a bad idea to rush:
-
You have under 25 students and one tutor — you can genuinely hold this in your head, and formal reconciliation is overhead you don't need yet. Do a light version of Stage 1 and stop.
-
You're mid-crisis on cashflow or staffing. Stabilize the fire first; analytics maturity is a build, not a rescue.
Who should not do this: A center that won't commit to the logging SOP. The entire roadmap rests on consistent event capture. If tutors won't log reliably — because of workload, buy-in, or no enforcement — you'll build Stage 2 reconciliation on sand and it'll collapse. Fix the logging culture first, even if it means a hard conversation about why it matters.
A 12-month implementation roadmap
Here's a realistic sequence for a center with a handful of staff. Adjust the pace to your bandwidth — this assumes the owner can give it a few hours a week, not full-time.
-
Months 1–2 (Instrument) Write the event dictionary. Define your five core events. Roll out the logging SOP and train every tutor. Start the weekly completeness check.
-
Months 3–4 (Instrument → stabilize) Hit the 95% completeness acceptance criteria for two straight weeks. Resolve definition disputes. Lock the dictionary.
-
Months 4–6 (Reconcile) Build the source-of-truth map for your top 3–4 KPIs. Run the first monthly reconciliation. Set tolerances. Start the root-cause log.
-
Months 6–8 (Reconcile → stabilize) Get all core KPIs within tolerance for two consecutive months. Fix recurring discrepancies at the source, not in the spreadsheet.
-
Months 8–10 (Experiment) Build your baseline library from reconciled numbers. Design and run your first experiment with a pre-defined success metric.
-
Months 10–12 (Experiment → habit) Complete a second experiment. Review the experiment log as a team. Decide what becomes standard practice and what gets re-tested.
By month 12 the win isn't a dashboard. It's that when someone asks "is this working?", you can answer with a number you actually trust — and you know how to test the next idea instead of guessing.
Real scenario: a two-location center that couldn't trust its own retention number
A center with two locations and around 130 active students kept getting contradictory retention figures. The scheduler suggested strong retention; the billing system implied more churn; the owner's gut said something in between. Decisions about which program to expand kept stalling because nobody trusted the inputs.
They ran the roadmap over roughly nine months. Stage 1 took longer than expected — two tutors were logging "completed session" differently, which alone accounted for a chunk of the discrepancy. Once the event dictionary was locked and completeness hit the mid-90s, Stage 2 reconciliation revealed the real retention number sat lower than the scheduler implied but higher than billing suggested — right around where the owner's gut had been, which actually built confidence in the new numbers rather than undermining them.
With a trustworthy baseline, they finally ran a Stage 3 experiment on their onboarding sequence. The reconciled before/after showed a few points of improvement in early retention — not dramatic, but real and measurable, which was the whole point. The outcome wasn't a flashy metric jump. It was that the owner stopped making expansion decisions on contradictory data and started making them on numbers the whole team agreed on.
The takeaway
Analytics maturity for a small tutoring center isn't about sophistication. It's about sequence. Capture events consistently, make your systems agree, and only then run experiments you can trust. Centers that respect that order build a foundation that holds as they grow. Centers that skip to the fun part — the experiments, the dashboards — keep making confident decisions on numbers that don't add up, and wonder why growth feels like guesswork.
Start where you are. If your logging isn't consistent, that's Stage 1, and there's no shortcut around it. The payoff of doing it in order is a center that can answer its own hardest questions — and test its next move — without the forty-minute reconciliation happening entirely in someone's head.
Ready to streamline your tutoring operations?
Join 500+ tutors and centers using Tutoryly to save time, improve scheduling accuracy, and enhance student experiences.