



Most tutoring centers can tell you how many students they have. Far fewer can tell you how many families are stuck between showing interest and booking a trial, or how many "active" students are quietly disengaging three weeks before they cancel. That blind spot isn't a marketing problem or a teaching problem — it's a lifecycle problem. The whole path a family travels, from the first Google search to the day their kid ages out, runs through four or five different people who each own one slice and none of whom own the whole thing.
The tutoring customer lifecycle funnel is really just a way of forcing that fragmented path into a shape you can see. When you map acquisition → onboarding → engagement → alumni against real KPIs, and you define exactly where one team hands the family off to the next, most of the "mystery churn" stops being mysterious. You start catching drop-off while it's still fixable instead of finding out in the monthly revenue report.
This isn't a pep talk about "focusing on retention." It's an operational breakdown of where families actually fall out, who's supposed to catch them, and what the dashboard needs to show so nobody's guessing.
Why the lifecycle breaks even when every individual part works
A lot of owners get tripped up by this: each stage of your business can be running fine on its own while the lifecycle as a whole leaks badly.
Marketing generates leads. The front desk books trials. Tutors teach great sessions. Progress reports go out. Every department, measured in isolation, looks healthy. But the leaks live between the departments — in the handoffs. A family fills out an inquiry form on Sunday night, nobody responds until Wednesday, and by then they've booked with the center down the road. That lead never shows up as a "loss" anywhere, because marketing counted it as a lead and the front desk never counted it at all. It just evaporated in the gap.
In real operations, this usually happens because the lifecycle is owned by roles, not by a single view. The front desk person genuinely thinks their job ends when the trial is scheduled. The tutor thinks their job starts when the student walks in. Nobody owns the 48 hours in between, which happens to be the window where most trial no-shows are decided.
-
Marketing → Front desk leads that go cold before first contact
-
Front desk → Tutor trials booked but never briefed, so the first session is generic
-
Tutor → Retention students disengaging with no trigger to flag it
-
Active → Alumni families who leave with zero structured offboarding, so they never refer anyone or come back for a sibling
You don't fix this by working harder inside each box. You fix it by defining the funnel across the boxes and deciding, on paper, what event moves a family from one stage to the next — and who's responsible when that event doesn't happen on time.
The four stages, and the KPI that actually matters for each
Most lifecycle diagrams throw a dozen metrics at you. In practice, each stage has one or two numbers that predict everything else. Track those obsessively and the rest are supporting detail.
Never miss another tutoring session.
Tutoryly helps you schedule, confirm, and manage every tutoring session efficiently.
- Unified session scheduling
- Automated student notifications
- Tutor calendar & availability management
No credit card required
| Stage | The one question it answers | Primary KPI | Leading indicator (catch it early) |
|---|---|---|---|
| Acquisition | Are we turning interest into booked trials? | Lead → trial-booked rate | Time-to-first-contact (hours) |
| Onboarding | Do new families make it to "paying and settled"? | Trial → paid conversion | First-session-to-second-session gap (days) |
| Engagement | Are active students staying and progressing? | Monthly retention / active rate | Attendance trend + session-note completeness |
| Alumni | Are departures turning into referrals and returns? | Referral + reactivation rate | % of exits with a completed offboarding |
The leading indicators in that last column are the ones worth staring at. Trial → paid conversion tells you what already happened. The gap between a student's first and second session tells you what's about to happen — a family that doesn't rebook within a few days of the first session converts far worse than one that books their next slot on the way out the door.
Worth calling out the acquisition-to-onboarding seam specifically, because that's where the most money leaks: the second someone books a trial, the clock on their impression starts. If your trial-to-paid conversion process doesn't kick in until after the trial happens, you're already behind. The pre-trial window — reminders, a quick "here's what to expect" note, making sure the tutor actually knows the student's situation — is part of conversion, even though it happens before the paid relationship exists.
Handoff triggers: the part everyone skips
A funnel diagram without defined handoffs is just a poster. The real operational work is deciding the trigger — the specific event that says "this family is now someone else's responsibility, and the clock is running."
Here's a workflow most centers can adapt directly.
1. Inquiry received → Front desk owns it (trigger: form submission or call) The moment a lead comes in, it's assigned to a named person with a response-time target. Not "the front desk" — a person. Unowned leads are the ones that rot. The target should be measured in hours, not days. If contact hasn't happened within your window, the lead escalates to whoever's next on shift.
2. Trial booked → Tutor gets briefed (trigger: confirmed trial slot) Booking a trial should automatically generate a short brief for the assigned tutor: grade, subject, why the parent reached out, any red flags. This is the handoff that gets skipped most often, and it's why so many first sessions feel like the tutor is meeting the kid cold. A generic first session is a conversion killer. Your student onboarding checklist should be the thing that fires here, not something the tutor scrambles to fill out afterward.
3. Trial completed → Conversion follow-up owner (trigger: session marked complete) Someone owns the follow-up, and it happens within a fixed window while the experience is still fresh. The tutor's read on the session ("great fit, kid was engaged" vs "struggled, might need a different approach") should feed this conversation — not just a generic "so, want to sign up?"
4. Converted → Engagement monitoring (trigger: first paid session) Now the student enters the retention system. Attendance trends and session notes start mattering here. A student who misses two of their first four paid sessions is a churn risk hiding in plain sight.
5. Disengagement signal → Retention intervention (trigger: attendance drop or flat progress) Define the signal precisely: two consecutive absences, a two-week gap, or a stall in progress metrics. When it fires, someone reaches out before the family decides to leave. This is where regular progress reports earn their keep — they give you a legitimate, non-desperate reason to re-engage a wavering family.
6. Exit confirmed → Alumni flow (trigger: cancellation or graduation) A departure should trigger a real offboarding: a final summary, a genuine "here's what we'd do next if you ever come back," and a referral ask. Most centers do nothing here, which is why their alumni base is worth almost zero.
Visualize the handoff workflow like this:
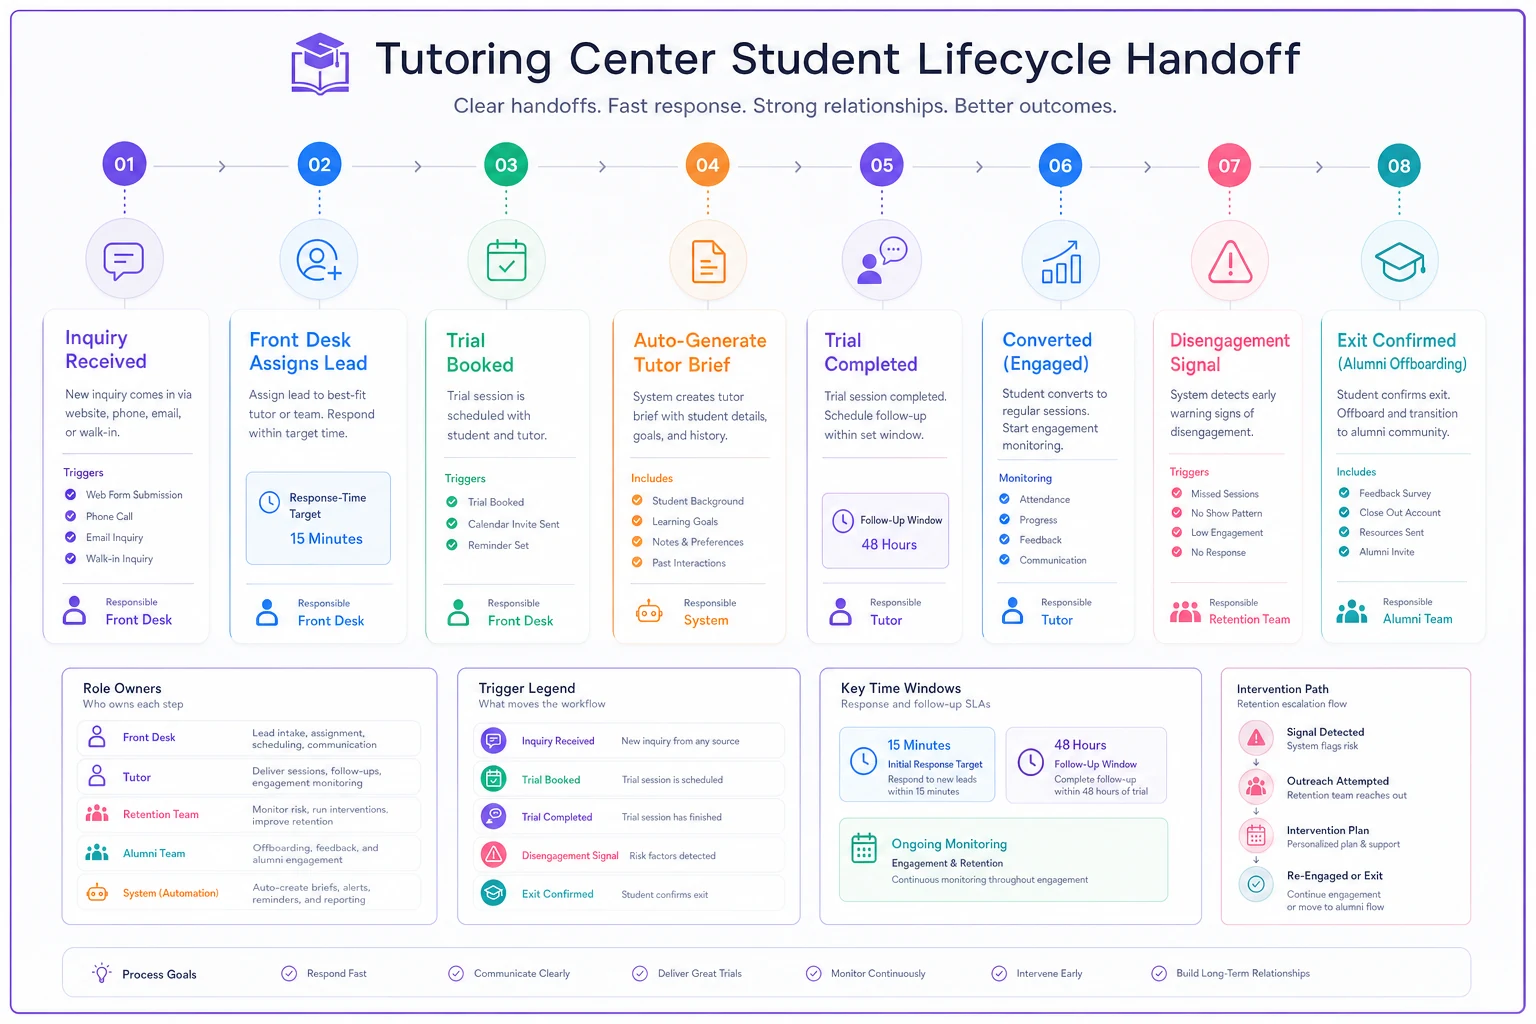
The trigger is the whole point. "We should follow up with trials" is a wish. "When a trial is marked complete, the follow-up owner has 24 hours" is a system.
What breaks at scale
At 20 or 30 students, one attentive owner holds the whole lifecycle in their head. They notice when a lead goes quiet. They remember which kid seemed shaky in their trial. It works because it's running on one person's memory.
That stops working around 60–80 active students, and it fails fast rather than gradually. The owner is now teaching, hiring, handling billing, and putting out fires. The mental model that used to catch every leak can't hold that many families anymore. Leads slip. Trials go un-briefed. Disengaging students aren't noticed until they're gone. And because the system was never written down, nobody on staff knows what they were supposed to be catching.
A typical pattern looks like this: a center grows from around 40 to about 90 students over a year and is thrilled with the growth. But monthly churn quietly creeps from maybe 4% to close to 8%. Nobody panics because the top of the funnel is still filling. Then acquisition has a slow month, and suddenly net numbers drop hard — because the leaks that were masked by growth are now fully exposed. The problem didn't start that month. It had been building the whole time, invisible because no one was measuring stage-to-stage flow.
The fix isn't more heroics. It's moving the lifecycle out of the owner's head and into a shared view where handoffs happen by trigger instead of by memory. This is the point where operational software starts pulling real weight — not as a magic solution, but as the place where the funnel lives so it doesn't depend on any one person remembering everything. When lead assignment, trial briefs, and disengagement flags are automated to fire on the triggers you defined, the system catches the leaks that a busy owner physically can't at that scale.
The dashboard blueprint
You don't need a data analyst. You need a handful of numbers arranged so that anyone glancing at them can tell whether the funnel is healthy. Build it in three panels.
Panel 1 — Acquisition & trial conversion
-
Leads received (this week / this month)
-
Median time-to-first-contact
-
Lead → trial-booked rate
-
Trial → paid conversion rate
-
Trials scheduled but not yet completed (the "in flight" number)
The one to watch here is time-to-first-contact plotted against conversion. When contact time creeps up, conversion drops a few weeks later, almost every time.
Plot time-to-first-contact alongside conversion — it's often the fastest early-warning signal.
Panel 2 — Onboarding health
-
New students in their first 30 days
-
% who booked a second session within X days of their first
-
% of new students with a completed onboarding/assessment on file
-
Early attendance rate (first four sessions)
This panel is your early-warning system. A student who's technically "active" but has a gap in their first month is your highest churn risk, and this is where you see it.
Panel 3 — Engagement & alumni flow
-
Active student count and month-over-month retention
-
Students currently flagged for disengagement
-
Exits this month, split by graduation vs. churn
-
% of exits with a completed offboarding
-
Referrals and reactivations from alumni
Split those exits. A student who graduates because they hit their goal is a success story and a referral source. A student who churns because they disengaged is a process failure. If your dashboard lumps them together, you'll never know which problem you actually have.
A real scenario
A two-location center with roughly 110 active students had a conversion problem they couldn't explain. Marketing was fine — leads were steady, around 30–35 a month. But trial-to-paid was sitting somewhere near 45%, which felt low for the quality of their tutors.
When they actually mapped the seam, the issue was obvious: median time-to-first-contact on new leads was close to two days, and about a third of trials were happening with zero tutor briefing. Kids were showing up and getting a generic first session because the front desk booked the slot but never passed along why the family came in.
They didn't overhaul anything dramatic. They set two triggers: leads must get a first-contact attempt within a few hours, and every booked trial auto-generates a one-paragraph brief the tutor has to read before the session. Time-to-contact dropped to under three hours. Trial-to-paid climbed into the high 50s over the next couple of months. Same leads, same tutors — they just stopped losing families in the gaps between people.
When this level of structure makes sense (and when it doesn't)
Do this if: you're past the point where one person can track every family by memory — realistically anywhere north of 50 active students, or if you have multiple staff touching the customer journey. The moment a handoff crosses between two people, you need a defined trigger, or something falls through.
Hold off if: you're a solo tutor with 15 students. You are the whole funnel. Building elaborate dashboards for a caseload you can hold in your head is procrastination dressed up as strategy. Keep a simple list, focus on teaching, and revisit this when growth actually strains your memory.
Be careful if: you're tempted to measure everything at once. Centers that try to track 25 KPIs end up looking at none of them. Start with the one primary metric per stage from the table above. Add leading indicators only after the basics are running. A dashboard nobody looks at is worse than no dashboard, because it creates the illusion that you're on top of things.
Pulling it together
The reason the tutoring customer lifecycle funnel is worth mapping isn't that funnels are trendy. It's that your revenue doesn't leak from inside your departments — it leaks from the space between them, in handoffs nobody explicitly owns. Marketing, front desk, and tutors can each be excellent while families quietly slip through the cracks in the seams.
Define the stages, name the one KPI that matters at each, write down the exact trigger that moves a family forward and who catches it if the trigger fires late. Then put those numbers somewhere everyone can see them. Do that, and "mystery churn" turns into a short list of specific, fixable gaps — the kind you can actually do something about before the family is already gone.
Ready to streamline your tutoring operations?
Join 500+ tutors and centers using Tutoryly to save time, improve scheduling accuracy, and enhance student experiences.