



Most tutoring centers can tell you their monthly revenue and their student count. Very few can tell you why a student renewed. Was it the tutor? The score jump? The parent report? Or just inertia because canceling felt like a hassle?
That gap — the missing link between what happens in the tutoring room and what happens in the bank account — is probably the most expensive blind spot in this business. You can run great sessions and still bleed students. You can also run mediocre sessions and coast on relationships for a while, right up until a competitor with a cleaner value story shows up.
What this post walks through is a way to connect those two worlds. Not a dashboard, not a list of KPIs to track for the sake of tracking. A causal chain: assessment → session behavior → short-term learning outcomes → revenue impact. Each link feeds the next, and each link has a small set of metrics worth measuring. When you can see the whole chain, you stop guessing which investments actually move retention and lifetime value.
Why most tutoring metrics don't connect to anything
The usual failure isn't that centers don't measure. It's that they measure in silos. The academic side lives in one place — tutor notes, quiz scores, maybe a rubric. The business side lives in another — MRR, churn, average contract length. Nobody builds the bridge, so decisions get made on vibes.
A typical example: a center owner notices renewals dipped in the spring. Their instinct is to blame pricing, so they run a discount. Renewals recover slightly, margin drops, and they conclude the discount "worked." What actually happened? Two of their strongest tutors left in February, session quality dropped for around 40 students, learning gains flattened, and that's what drove the churn. The discount masked a pedagogy problem with a pricing patch. Next spring, same thing happens, and now they've trained families to expect discounts.
This is the core issue. When you can't trace an outcome back through the chain, you fix the wrong link. And the wrong fix usually costs more than the right one.
Centers that get this right treat pedagogy and revenue as one connected system, not two departments. That's the whole point of a pedagogy to business outcomes tutoring measurement framework — it forces you to define, upfront, how a rubric score is supposed to turn into a renewed contract.
The four links in the chain
Below is each stage defined plainly, then the metrics that actually matter at each one. The rule for choosing metrics: if a number can't influence the next link in the chain, drop it. Vanity metrics describe a stage but predict nothing downstream.
Never miss another tutoring session.
Tutoryly helps you schedule, confirm, and manage every tutoring session efficiently.
- Unified session scheduling
- Automated student notifications
- Tutor calendar & availability management
No credit card required
Link 1 — Assessment
This is your baseline. The diagnostic you run at intake, plus whatever periodic re-assessments you do. The job of assessment isn't just to place a student — it's to create the starting point you'll measure growth against. If your baseline is sloppy, every gain number downstream is noise.
-
Baseline reliability — do two assessments a week apart produce roughly the same score? If not, your instrument is noisy.
-
Diagnostic coverage — what percentage of the actual curriculum skills does the assessment touch? A math diagnostic that only tests arithmetic tells you nothing about where an algebra student will struggle.
-
Time-to-first-plan — how long between assessment and a concrete, skill-targeted lesson plan. This one quietly predicts early churn.
The mistake here is treating assessment as a sales tool only. A lot of centers run a "free assessment" that's really a pitch in disguise, with a score designed to scare the parent into signing. That gets you the first payment and poisons your entire measurement chain, because now your baseline is inflated and every future gain looks smaller than it is.
Link 2 — Session behavior
This is what actually happens in the room (or on the call). It's the most under-measured link by far, because it feels subjective. But session behavior is where pedagogy becomes real, and it's completely measurable if you commit to a rubric and to session fidelity checks.
-
Rubric score per session — a simple 1–4 across a few dimensions (clarity, student engagement, error correction, plan adherence). This is the same rubric logic behind a working quality-assurance loop.
-
Session fidelity rate — percentage of sessions that followed the assigned plan versus drifted.
-
Active student talk-time — rough estimate of how much the student worked versus watched. Passive sessions feel productive to parents and produce almost no gains.
-
Notes completeness — did the tutor log what was covered and what's next? Incomplete notes break the chain at the handoff.
Session fidelity means: did the session actually follow the plan the assessment produced? A tutor who improvises every session might be great — or might be winging it because prep is annoying. You can't tell without measuring adherence.
Link 3 — Short-term learning outcomes
These are the near-term wins that a parent can actually feel within a few weeks: a quiz score climbing, homework getting done independently, a kid who stopped dreading Tuesday sessions. Short-term is the operative word. Test-score improvements that take six months to show up won't save a contract that renews in eight weeks.
-
Skill mastery velocity — how many targeted skills moved from "not mastered" to "mastered" over a 3–4 week window.
-
Independent-work rate — is the student needing less scaffolding on the same skill type over time?
-
Perceived progress signal — a quick parent-facing check-in score. This is soft, but it's the number closest to the renewal decision.
Centers consistently over-index on big, slow outcomes (SAT jumps, report-card GPA) and ignore the small fast ones that actually drive the renewal conversation. Parents renew on momentum they can perceive, not on statistically valid gains.
If you want the deeper mechanics of tying each session to a measurable outcome, that's covered well in this piece on progress-tracking systems that connect sessions to outcomes.
Link 4 — Revenue impact
The final link. Renewals, contract length, upsells to more sessions per week, sibling adds, referrals, and ultimately lifetime value. The whole framework exists so you can say: this pedagogical change produced this revenue change.
-
Renewal rate by cohort — grouped by tutor, subject, and baseline level.
-
LTV by entry path — students who came in through a solid assessment versus a rushed one.
-
Expansion revenue — added sessions or subjects, which almost always correlate with perceived progress from Link 3.
-
Referral rate — the cleanest downstream signal that the earlier links are working.
Sample metrics at this link: Renewals, contract length, upsells to more sessions per week, sibling adds, referrals, and ultimately lifetime value. The whole framework exists so you can say: this pedagogical change produced this revenue change.
The full chain, side by side
Here's how the links map together, with what to measure and what each stage predicts:
| Link | What it captures | Sample metrics | What it predicts downstream |
|---|---|---|---|
| Assessment | Baseline & plan quality | Baseline reliability, coverage, time-to-first-plan | Whether gains can be measured at all; early churn |
| Session behavior | What happens in the room | Rubric score, fidelity rate, student talk-time, notes completeness | Learning outcomes; tutor-driven churn |
| Learning outcomes | Near-term, felt progress | Mastery velocity, independent-work rate, perceived progress | Renewal likelihood; expansion |
| Revenue impact | Business result | Renewal rate, LTV, expansion revenue, referrals | Where to reinvest |
The value of laying it out this way isn't the table itself. It's that you can now ask a sharper question when a number moves: which upstream link caused this? A drop in renewals sends you back to learning outcomes, which sends you back to session fidelity, which might send you back to a broken assessment. You debug the chain instead of guessing.
A prioritization matrix for where to invest
Once you can see the chain, the next problem is deciding what to fix or test first. You'll have more ideas than time. The trap is chasing the loudest problem instead of the highest-leverage one.
-
High link to revenue, low effort — do these immediately. Example: enforcing notes completeness so handoffs stop breaking. Cheap, and it protects continuity that directly affects churn.
-
High link to revenue, high effort — plan these deliberately. Example: rebuilding your assessment instrument so baselines are reliable. Painful, but it fixes the root of the whole chain.
-
Low link to revenue, low effort — do them if you're bored, otherwise skip. Example: prettier report formatting.
-
Low link to revenue, high effort — avoid. Example
building an elaborate custom analytics dashboard nobody will read. This is where centers waste months.
The uncomfortable insight here: most centers spend their energy in quadrant three — easy, low-impact tweaks that feel productive — and avoid quadrant two because those require confronting a broken diagnostic or a weak tutor. The framework's real job is to push you toward quadrant two.
Worked example: mapping rubrics to an LTV decision
Run numbers through the chain so it's concrete.
A center runs about 180 active students. Average contract is roughly $4,200 a year, and their blended renewal rate sits around 62%. Not bad, not great. Leadership assumes the problem is price and considers a package restructure.
Instead, they look at the chain. They pull rubric scores by tutor and cross them against renewal rate. The pattern is hard to miss: students with tutors scoring 3.5+ on session rubrics renew at about 74%, while students with tutors scoring below 2.8 renew at roughly 48%. Same pricing, same subjects. The gap is session quality, not cost.
They dig into session fidelity for the low-rubric tutors and find fidelity rates around 55% — meaning nearly half of those sessions drifted off the assessment-driven plan. The kids weren't getting targeted practice, mastery velocity was flat, parents felt no momentum, and they walked.
The LTV math isn't complicated. Moving the bottom group's renewal from 48% to even 60% across the roughly 50 affected students is worth somewhere in the $25k–$30k range in retained annual revenue — before counting the referral and expansion tail that comes with families who actually see progress. Compare that to the discount plan, which would have cost margin and never touched the real cause.
So the investment decision writes itself: coaching and fidelity enforcement for the low-rubric tutors, not a price cut. That's a quadrant-two move, and the chain is what made it visible. The mechanics of running this kind of lightweight comparison without needing a huge sample are laid out in measuring tutoring impact with small-sample experiments.
When this framework actually makes sense
This is worth building when you're past the point where one person can hold the whole operation in their head. Once you've got more than a handful of tutors and somewhere past 60–80 active students, the informal "I just know my students" approach stops scaling. Relationships that used to carry renewals start slipping through cracks nobody's watching.
It also makes sense when you're about to make a real investment — hiring, opening a location, restructuring packages — and you want to know which lever actually pays back.
When it's a bad idea (or premature)
If you're a solo tutor with 15 students, don't build this. You already have the whole chain in your head, and the overhead of formal rubrics and fidelity tracking will cost more time than it saves. A simple progress log is fine.
It's also premature to build the measurement chain before fixing obvious operational leaks. If half your no-shows come from a broken reminder system, measure and fix that first. A causal framework on top of a chaotic operation just gives you very precise data about a mess.
And don't build the whole thing at once. Centers that try to instrument all four links simultaneously usually abandon it. Start with the one link that's most obviously broken — often session behavior, since it's the least measured — and extend from there.
Making the chain hold together in daily operations
A framework is only as good as the data feeding it, and in real operations the chain breaks at the boring points: tutors who skip notes, assessments that get run inconsistently, rubric scores that one manager fills out generously and another fills out harshly. Consistency is the whole game.
A few things that keep it honest:
-
One rubric, calibrated. Have your team score the same recorded session and compare. If scores vary wildly, your rubric is subjective and your data is worthless until you align.
-
Make data capture part of the session, not homework. If logging notes and rubric scores happens after hours, it won't happen. Bake it into the session-close workflow.
-
Review the chain on a fixed cadence. Monthly is usually right — frequent enough to catch drift, not so frequent you're reacting to noise.
-
Close the loop with tutors. Show them how their session rubric connects to their students' renewals. When tutors see the chain, fidelity improves without you nagging.
Make data capture part of the session, not homework.
This is also where good operational software earns its place. Not as a magic fix, but as the thing that quietly captures rubric scores, fidelity flags, and outcome data at the moment they happen, then surfaces the connection between a session and a renewal without you stitching five spreadsheets together by hand. The point isn't the tool. The point is that the chain only produces trustworthy signals if the data underneath it is captured consistently, and manual capture rarely stays consistent at scale.
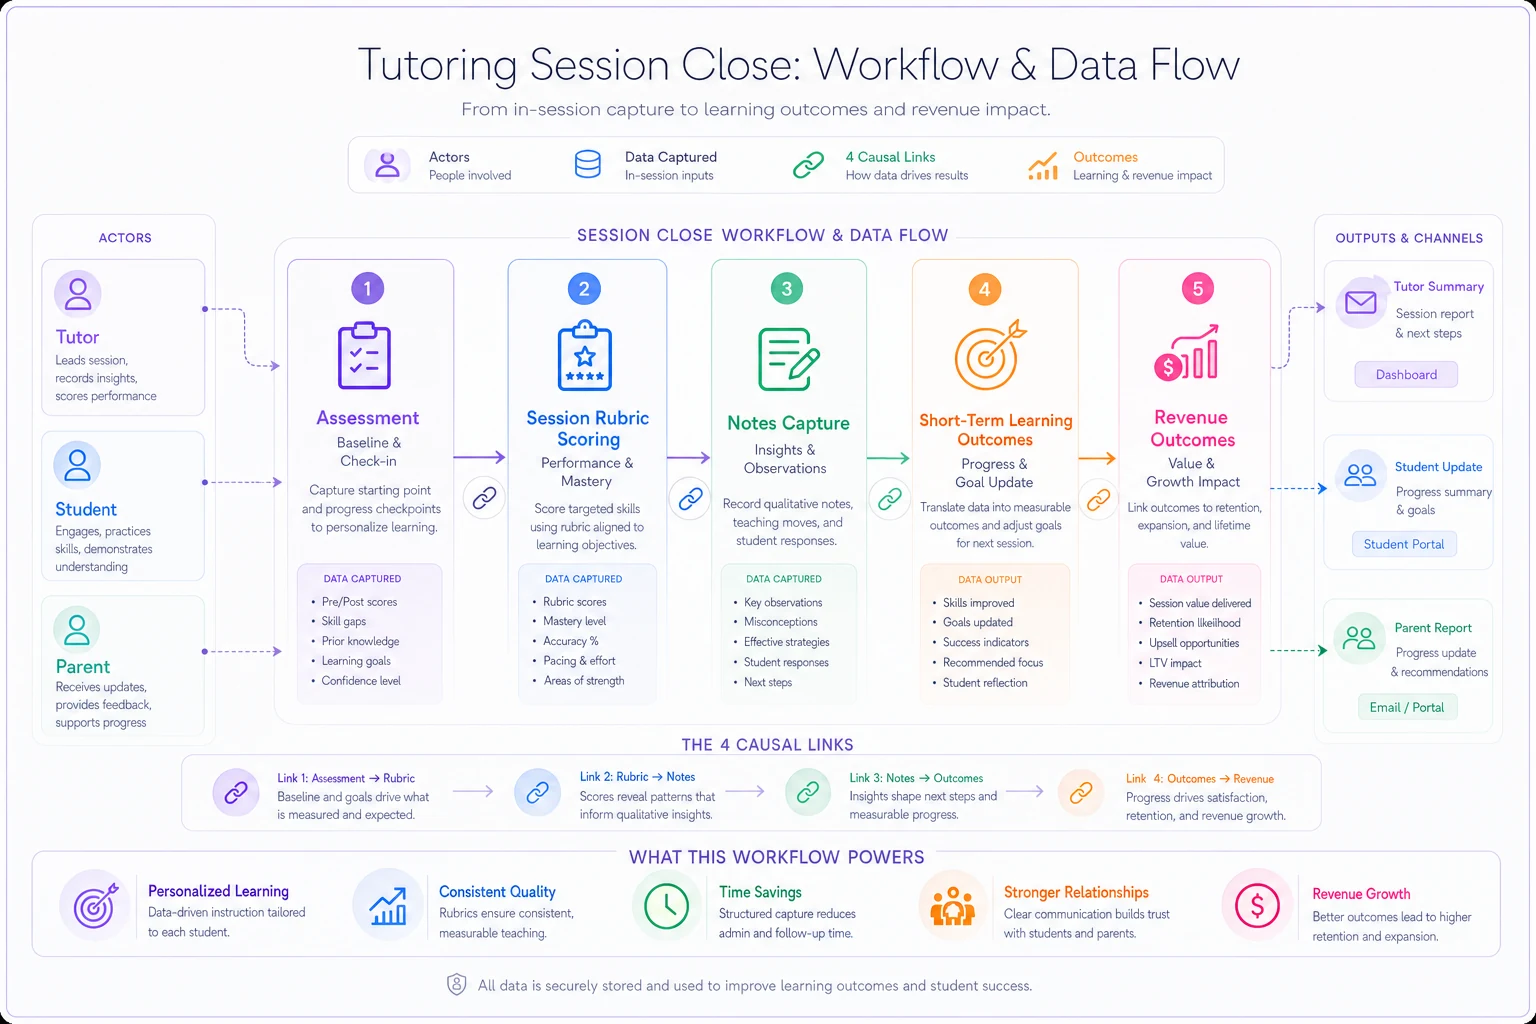
This diagram maps the session-close workflow and how captured data flows through the four links.
Bringing it together
The reason tutoring centers make expensive wrong decisions isn't a lack of data — it's a lack of connection between the data they already have. Assessment scores sit in one folder, session notes in another, revenue in a third, and nobody has drawn the line from one to the next.
Build that line. Define what a good rubric score is supposed to do to learning outcomes, and what those outcomes are supposed to do to renewals. Then measure whether it actually happens. When a number moves, walk it back through the chain to find the real cause instead of patching the symptom.
That single discipline — tracing effects to their source — is what separates centers that grow deliberately from ones that lurch from discount to discount hoping something sticks. Start with your weakest link. For most centers, that's session behavior, because it's the one nobody's been watching. Get that measured cleanly, connect it to renewals, and let the rest of the chain follow.
Ready to streamline your tutoring operations?
Join 500+ tutors and centers using Tutoryly to save time, improve scheduling accuracy, and enhance student experiences.