


Most tutoring centers track the obvious stuff. Sessions completed. Revenue collected. New student signups. But there's a measurement gap that explains why retention rates plateau around 65-70% after twelve weeks, regardless of pricing strategy or tutor credentials.
The gap between what tutors do and what parents think is happening
The gap sits between what tutors actually do in sessions and what parents think is happening. Without structured quality assurance, this disconnect compounds week after week until families simply fade away—no complaints, no dramatic exits, just gradual schedule reduction followed by radio silence.
Centers with formal QA loops consistently hit 85% six-month retention. Centers without them hover around 60%, regardless of marketing spend or tutor qualifications. The difference isn't the tutors themselves—it's whether anyone is systematically watching, measuring, and improving what happens during actual sessions.
Quality assurance in tutoring isn't about micromanaging educators. It's about creating feedback mechanisms that catch problems before parents notice them. Problems like tutors defaulting to homework help instead of skill building. Or spending forty minutes on one math problem while the student zones out. Or never adjusting their approach despite three weeks of minimal progress.
These issues kill retention slowly. Parents don't immediately pull their kids when progress stalls. They reduce from twice weekly to once weekly. Then to every other week. Then they "take a break for soccer season" and never come back. Meanwhile, the center wonders why LTV calculations never match reality.
Building observation rubrics that actually measure teaching effectiveness
Generic teaching rubrics fail in tutoring contexts. The one-on-one dynamic requires different evaluation criteria than classroom instruction. You need rubrics that capture both pedagogical skill and relationship management—and those two things don't always overlap.
Never miss another tutoring session.
Tutoryly helps you schedule, confirm, and manage every tutoring session efficiently.
- Unified session scheduling
- Automated student notifications
- Tutor calendar & availability management
No credit card required
Start with session structure metrics. Does the tutor begin with a clear agenda? Not a vague "we'll work on math today" but specific objectives like "master two-digit multiplication using the box method." Track whether they check for understanding every 10-12 minutes. Document if they close with a next-session preview and a meaningful parent update.
Then layer in engagement indicators. Count student-initiated questions versus tutor-initiated questions. Measure talk-time ratios—effective tutors maintain roughly a 40/60 student/tutor split during skill instruction, flipping to 60/40 during practice. Note when students lean forward versus slouch back. Physical positioning reveals comprehension better than verbal confirmation.
Academic rigor forms the third rubric layer. Are tutors teaching at, above, or below grade level? How often do they reference school curriculum versus generic materials? Track whether they're building foundational skills or just patching homework gaps. Document their use of varied instructional methods—visual, auditory, kinesthetic—within single sessions.
The relationship management dimension often gets overlooked but directly impacts retention. Does the tutor remember personal details? Do they celebrate small wins explicitly? How do they handle frustration—theirs and the student's? Rate their parent communication: specific progress updates versus generic "doing great" messages.
Create numerical scales for each dimension. Use 1-5 ratings with specific behavioral anchors. A "3" for engagement might mean "student responds to direct questions but doesn't initiate." A "5" means "student asks clarifying questions and connects concepts to previous learning unprompted." Keep the rubric to two pages maximum. Include space for specific examples and timestamps. Train observers to cite exact moments: "At 4:23pm, tutor used manipulatives to demonstrate fraction concepts when verbal explanation wasn't landing."
The observe-feedback-coach-recertify cycle that prevents quality drift
Observation without action wastes everyone's time. You need a predictable cadence that turns rubric scores into actual performance improvements.
Month one for new tutors involves weekly observations. Not full sessions—that's resource-intensive and anxiety-inducing. Instead, conduct three 15-minute drop-ins per week at varying times. First 15 minutes one day, middle 15 another, final 15 on the third. This sampling catches different session phases without overwhelming observers or tutors.
Schedule feedback within 48 hours of observation. Longer delays reduce impact. Structure feedback using the SBI model: Situation, Behavior, Impact. "When Marcus struggled with long division (situation), you immediately switched to calculator work (behavior), which prevented him from developing the computational fluency needed for his upcoming exam (impact)."
Limit feedback to three items per session. One strength to reinforce, one critical improvement, one growth opportunity. More than three creates cognitive overload. Less than three feels unsubstantial. Document all feedback in writing, even if delivered verbally.
Coaching differs from feedback. Feedback identifies what happened. Coaching develops skills to change what happens next. Schedule monthly one-on-ones for all tutors, regardless of performance level. High performers need growth paths too, or they'll plateau and eventually leave.
During coaching, review aggregated rubric scores and look for patterns across multiple observations. If engagement scores consistently dip in final session quarters, practice closure techniques. If parent communication scores lag, role-play update conversations. Use actual session recordings when possible—most parents consent if you explain it's for quality improvement.
The recertification component closes the loop. Every six months, tutors complete formal recertification. Frame it as professional development, not punishment. Include three components: knowledge assessment on curriculum and pedagogy, a live demonstration lesson with feedback, and a self-reflection portfolio reviewing their rubric progression. Tutors who don't meet recertification standards enter intensive support mode—two weeks of daily observations, specialized coaching, and paired sessions with senior tutors. If performance doesn't improve after that, transition them to different roles or exit gracefully. One consistently underperforming tutor can tank retention rates across their entire student roster.
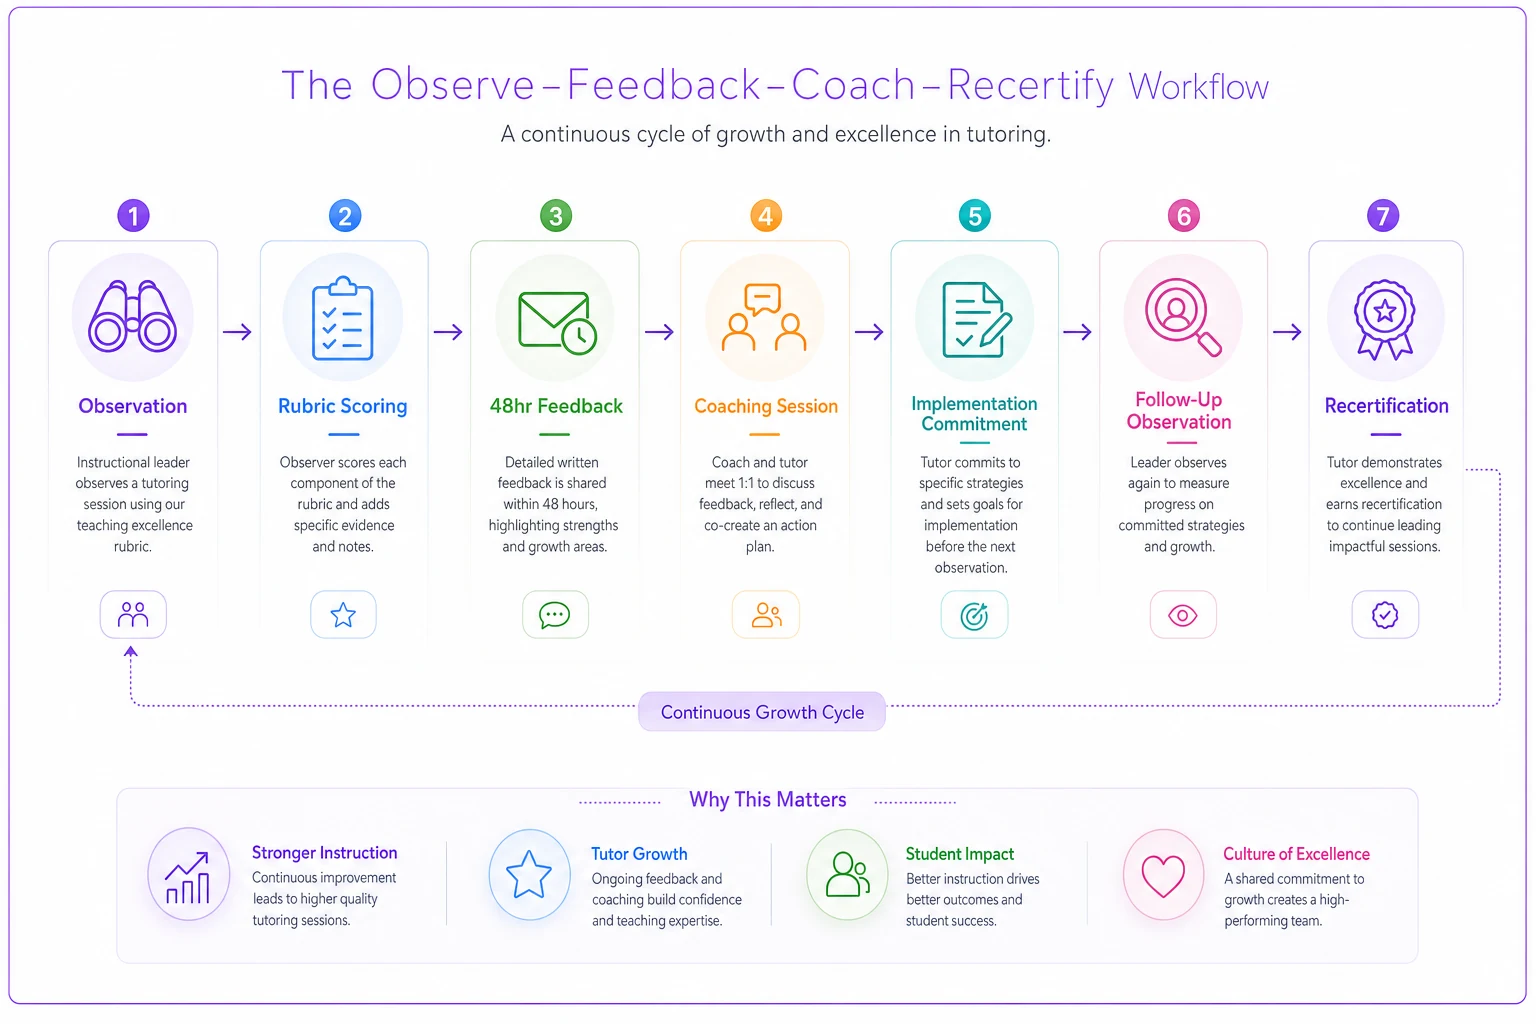
Visual of the QA loop:
Frame recertification as development and keep documentation tight so tutors view it as growth rather than punishment.
The QA cycle in practice
The observe-feedback-coach-recertify loop isn't just a concept—it's a repeating operational process. Here's how each phase connects:
[Observation] → [Rubric Scoring] → [48hr Feedback] → [Coaching Session] → [Implementation Commitment] → [Follow-Up Observation] → [Recertification at 6 months] ↑ | └───────────────────────────────────────────────────────────────────────────────────────────────────────────────┘
Each loop produces documented data that feeds the next cycle. Over time, patterns emerge across tutors, dimensions, and student cohorts—and those patterns are where the real operational insight lives.
Connecting QA scores to retention and referral metrics
Quality assurance without business impact measurement is just expensive theater. You need clear connections between rubric scores and revenue outcomes.
Start tracking retention by tutor, not just center-wide. Plot each tutor's average rubric scores against their student retention rates at 4, 8, 12, and 24-week marks. Patterns emerge fast. Tutors scoring below 3.5 on engagement rarely retain students past week 8. Those below 3.0 on parent communication see minimal referrals regardless of academic outcomes.
Build correlation matrices between specific rubric dimensions and business metrics. In education operations analysis, engagement scores correlate with retention around r=0.72. Parent communication correlates with referral rate around r=0.68. Academic rigor, interestingly, shows weaker correlation (r=0.45) with retention but strong correlation with price tolerance—parents pay more for tutors who maintain high academic standards.
Create cohort analyses comparing students of high-scoring versus low-scoring tutors. Track not just retention but session frequency, package upgrades, and sibling enrollments. A tutor averaging 4.2 overall typically generates significantly higher LTV per student than one averaging 3.4. That differential justifies QA investment many times over.
Measure referral patterns specifically. When parents refer friends, which tutors do they request by name? High QA scores create name-recognition that drives specific tutor requests, which lets you premium-price certain tutors and creates scheduling leverage you wouldn't otherwise have.
Don't overlook the indirect metrics either. Track parent response rates to scheduling emails by tutor. High-QA tutors tend to see notably better response rates. Parents engage more with tutors they trust. Similarly, measure payment timeliness—parents delay or dispute payments more frequently with underperforming tutors.
Set up attribution windows properly. Retention impacts lag QA improvements by 4-6 weeks. A tutor who improves from 3.2 to 4.0 in January won't show retention gains until late February. Referrals lag even longer—typically 8-12 weeks. Understanding these delays prevents premature program abandonment.
Sample dashboards and alert systems to track quality impact
Static reports hide urgent issues. You need dynamic dashboards that surface problems before they become parent complaints.
Your primary dashboard should display three panels: current state, trending, and alerts. Current state shows this week's observation scores by tutor and dimension. Trending reveals score movement over rolling 4-week periods. Alerts flag sudden drops or persistent low scores requiring intervention.
Build the current state panel with heat mapping. Green for scores above 4.0, yellow for 3.5-4.0, red below 3.5. Include session counts for context—a red score on one observation means less than red scores across five. Display center-wide averages for benchmarking.
The trending panel needs sparklines for each tutor showing 12-week score progression. Add trajectory indicators—upward arrows for improving trends, downward for declining. Include variance bands. Consistently volatile scores indicate different problems than steady low scores. High variance often means inconsistent preparation or external stressors affecting performance.
Alert logic should trigger on multiple conditions:
-
Immediate alerts for any score below 2.5—that's crisis territory requiring same-day intervention
-
Weekly alerts for tutors whose 4-week average drops more than 0.5 points
-
Monthly alerts for tutors stuck below 3.5 for three consecutive weeks
Create role-specific dashboard views. Center directors see aggregate metrics and exception reports. Lead tutors see their team's performance with peer comparisons. Individual tutors see their own scores with growth tracking. Parents never see rubric scores directly—they see outcome metrics like skill progression and milestone achievement.
Include predictive elements. Based on historical patterns, flag students at retention risk when their tutor's scores drop below threshold levels. If a tutor averaging 3.2 on engagement takes on a new student, mark that relationship for proactive monitoring. These early warnings prevent surprises.
Add operational metrics to your quality dashboard too. Show observation completion rates—are managers actually conducting planned observations? Track feedback delivery timeframes. Monitor coaching session attendance. Quality assurance fails when the process itself isn't followed consistently.
Build automated reports for different stakeholders. Weekly email to tutors with their rubric scores and one specific improvement suggestion. Bi-weekly report to parents showing their child's skill progression (not tutor scores). Monthly board report connecting QA metrics to revenue impact. Configure your dashboards for mobile viewing. Managers need to check metrics between sessions, during commutes, at home. Desktop-only dashboards get ignored.
The standardized coaching playbook that transforms observation data into skill development
Observations identify problems. Coaching solves them. But coaching without structure wastes time and creates inconsistent results.
Your coaching playbook should map specific rubric deficiencies to targeted interventions. Engagement below 3.0? Assign the "active learning techniques" module covering questioning strategies, wait time, and student voice ratios. Parent communication lacking? Deploy the "weekly update templates" training with email scripts and progress tracking frameworks.
Structure each coaching module identically. Start with self-assessment where tutors predict their own scores. Compare against actual observation data. Gaps between self-perception and reality indicate awareness issues requiring different approaches than skill gaps. Include video review in every coaching session—not lengthy recordings, but two 5-minute segments highlighting the target skill. Watch together, pausing to discuss specific moments. "Notice how the student's posture changed when you switched from lecturing to questioning?" Video reveals patterns tutors miss in real-time.
Practice new techniques through role-play before implementing with students. If working on explanation clarity, have tutors explain concepts to you as if you're the student. For parent communication, simulate difficult conversations about lack of progress. This safe practice reduces implementation anxiety.
Set implementation commitments, not vague improvement goals. Instead of "engage students more," commit to "ask three open-ended questions in the first 10 minutes of next session." Specific actions create trackable progress. Document commitments in writing with target dates.
Follow the 10-20-70 learning model. Tutors spend 10% of development time learning concepts (reading, videos), 20% learning from others (coaching, peer observation), and 70% learning through practice. Most programs over-emphasize training and under-emphasize real-world application.
Create peer coaching partnerships between high and developing performers. Not mentorship—that creates hierarchy. Partnership means both tutors observe each other and exchange feedback. High performers often discover blind spots when watching others. Developing performers see techniques in action without the pressure of formal evaluation.
Track coaching effectiveness through pre/post metrics. Compare rubric scores before and after each coaching module. If scores don't improve within three weeks, the coaching approach needs adjustment. Sometimes tutors need different learning modalities—visual learners might need flowcharts instead of verbal instruction.
Differentiate coaching intensity based on performance trajectories. Rising tutors showing steady improvement need monthly touchpoints. Plateau tutors stuck at acceptable-but-not-great levels need bi-weekly intensive work. Declining performers require weekly intervention with clear improvement timelines. Build coaching resources for asynchronous learning—recorded demonstrations of high-scoring tutors handling common scenarios, technique libraries with short micro-lessons, self-evaluation checklists tutors complete between sessions, and lesson planning templates that embed best practices.
Why informal quality checks fail and formal QA systems succeed
The difference between casual quality monitoring and structured QA shows up starkly in retention data. Centers relying on informal checks—occasional parent surveys, ad-hoc observations, complaint-driven reviews—see quality drift inevitably.
Informal systems suffer from recency bias. That parent complaint last week overshadows three months of solid performance. The tutor who charmed during yesterday's observation might be coasting the other 95% of the time. Without systematic measurement, outlier events distort perception in both directions.
Formal QA creates accountability through transparency. When tutors know they'll be observed regularly using consistent criteria, performance stabilizes—not through fear but through clarity. They understand expectations and receive regular feedback on meeting them.
The documentation formal systems require also protects everyone. Parents claiming "the tutor never helped with writing" face session notes showing weekly writing instruction. Tutors worried about unfair termination have rubric scores showing consistent high performance. Centers defending premium pricing have quality metrics to back it up. Structured QA also reveals systemic issues invisible in informal systems. When multiple tutors score low on the same rubric dimension, that's a training gap, not individual failure. When scores drop center-wide during certain months, that signals operational stressors needing attention.
Investment in formal QA pays for itself through reduced turnover costs alone. Replacing a tutor costs somewhere around $3,000-$3,500 when you factor in recruiting, onboarding, and lost productivity during ramp-up. Preventing one unnecessary departure per quarter covers most QA program costs—and that's before counting retention and referral improvements.
Rubric dimensions, business metrics, and their correlations
Not every rubric dimension affects the same business outcome. Understanding these relationships helps you prioritize what to coach first.
| Rubric Dimension | Correlated Business Metric | Approx. Correlation | Lag to Impact |
|---|---|---|---|
| Engagement | Student retention (8-week) | r ≈ 0.72 | 4–6 weeks |
| Parent Communication | Referral rate | r ≈ 0.68 | 8–12 weeks |
| Session Structure | Package upgrades | r ≈ 0.55 | 6–8 weeks |
| Academic Rigor | Price tolerance / premium acceptance | r ≈ 0.45 | 10–14 weeks |
| Relationship Management | Sibling enrollments | r ≈ 0.60 | 12+ weeks |
These correlations aren't universal—they vary by student age group, center size, and market. But directionally, they hold across most operational audits. Use them to prioritize which rubric dimensions to coach first when resources are limited.
Building an observation schedule that doesn't burn out managers or stress tutors
Observation scheduling is where most QA programs fall apart. Either managers can't maintain the pace, or tutors feel constantly surveilled and start performing artificially.
Use stratified random sampling instead of fixed schedules. Each tutor gets observed a set number of times monthly, but timing varies randomly within parameters. This prevents performance theater while ensuring coverage. Tutors can't "turn it on" for scheduled observations when they don't know when they're happening.
Pro-tip: Use stratified random sampling to prevent performance theater and reduce manager burnout.
Weight observations toward risk factors. New tutors need weekly observation for their first month. Tutors with declining scores need increased frequency. High performers consistently earning 4.5+ can move to monthly observation. This risk-based approach optimizes limited observer resources.
Rotate observers to prevent relationship bias. If the same manager observes the same tutor repeatedly, scores drift toward relationship quality rather than actual performance. A three-person rotation where possible—direct manager, peer lead tutor, and senior leadership—keeps scoring honest.
Implement pop-in observations alongside full-session reviews. Five-minute check-ins count as observations when using specific rubric subsections. These quick touches reduce observer burden while maintaining presence. A manager can complete several pop-ins during the same time it takes to do one full-session review.
Schedule observation blocks, not individual appointments. Dedicating Tuesday afternoons to observations creates efficiency through batching. Observers stay in evaluation mindset without constant task-switching. Administrative work concentrates instead of bleeding across the week.
Balance announced versus unannounced observations. Monthly announced observations let tutors showcase their best work and receive coaching on advanced techniques. Periodic unannounced spot-checks capture typical performance. The combination gives you a more complete picture than either approach alone.
Track observation burden metrics. If managers spend more than 15% of their time on observations, the system isn't sustainable. If tutors get observed more than once weekly, performance anxiety starts interfering with authenticity. Monitor these thresholds and adjust. AI-powered operational platforms can reduce observation logistics significantly. Remote sessions can be reviewed asynchronously. In-person sessions might use audio recording with consent. Automated systems can flag sessions for review based on parent feedback or outcome metrics, helping focus human observation on the highest-priority situations rather than spreading it thin.
The feedback framework that gets tutors to actually improve (not just comply)
Feedback without behavior change is just criticism with extra steps. The structure and delivery of feedback determines whether tutors actually improve or simply become defensive.
Timing matters more than most people realize. Deliver feedback within 48 hours while session details remain fresh—but not immediately after observation when emotions run high. Next-day is usually the sweet spot, after both parties have processed but before memories fade.
Use the GROW model adapted for tutoring contexts. Goal: What specific outcome are we targeting? Reality: What did observation data show? Options: What techniques could achieve the goal? Way Forward: Which technique will you implement and when?
For example: The goal is increasing student engagement during problem-solving. Reality shows the student answered only "yes/no" questions during 20 minutes of math work. Options include think-aloud protocols, peer teaching, or mistake analysis. Way Forward commits to trying think-aloud protocol in the next three sessions.
Frame feedback as collaborative problem-solving, not evaluation. "I noticed Sarah seemed disconnected during fraction work. What's your read on that?" invites dialogue. "Your engagement score was low" triggers defensiveness. Same information, very different response.
Provide specific replacement behaviors, not just criticism. Instead of "stop lecturing so much," offer "try this three-step questioning sequence when introducing new concepts." Tutors need actionable alternatives, not just awareness of problems.
Connect feedback to student outcomes rather than rubric scores. "When you had Marcus explain his thinking, he caught his own error—that's the self-monitoring we're building" resonates more than "your questioning technique scored 4.5."
Document feedback in a structured format. Date, observer, specific observations, agreed actions, follow-up date. This creates accountability and tracks whether feedback actually leads to change. Patterns of ignored feedback justify more serious interventions.
Balance affirmative and corrective feedback in sustainable ratios. Not artificial "compliment sandwiches" but genuine recognition alongside improvement areas. Roughly 3:1 affirmative to corrective maintains receptiveness without sugarcoating real problems. Each session's feedback should also reference previous commitments. "Last week you committed to checking for understanding every 10 minutes. I saw you do this three times today—how did it feel?" This continuity signals that feedback actually matters.
Metrics that prove QA investment delivers ROI through retention and referrals
QA programs require upfront investment and ongoing resources. Centers need concrete ROI evidence to maintain investment when budgets get tight.
Calculate retention improvement value precisely. If QA improves 6-month retention from 65% to 80%, and average student value is $3,600, that's $540 additional revenue per student. Across 100 students, that's $54,000 annually from retention alone.
Measure referral rate changes. Centers with formal QA tend to see meaningfully more referrals per family than those without. Each referral worth $3,600 compounds as referred families refer others—the math adds up quickly.
Track pricing power improvements. Parents often pay 15-20% premiums for tutors with documented quality scores above 4.0. If you can increase average hourly rate from $65 to $75 through quality differentiation, that's meaningful additional revenue per student annually.
Document cost avoidance from prevented complaints. Each escalated parent complaint costs hours of management time plus potential refunds or free sessions. QA systems catching issues early prevent the majority of escalations before they become problems.
Include tutor development value. Tutors receiving regular coaching through QA show lower turnover. With replacement costs around $3,000-$3,500 per tutor, preventing several departures annually adds up. Developed tutors can also handle more challenging students at higher rates.
Calculate lifetime value extension. Students of high-QA tutors tend to stay significantly longer than those with low-QA tutors. Even a few additional months of retention per student, multiplied across your student base, creates substantial impact.
Factor in operational efficiency gains. QA systems surface systemic issues that reduce rework. If poor session notes cause hours of weekly clarification and correction, fixing that through QA saves real time. Consider competitive advantage value too. School districts increasingly require quality documentation for partnership contracts. Corporate education benefits programs demand QA metrics. Access to these channels depends on systematic quality measurement.
Present ROI in terms that resonate with ownership. Not rubric scores but revenue impact. Something like: "QA investment of $24,000 annually generates significantly more in improved retention, increased referrals, and operational savings. The return is multiple times the cost within two years."
Adapting QA systems as your center scales from 10 to 100 tutors
Quality assurance that works at 10 tutors breaks at 30 and becomes impossible at 100. Systems must evolve with scale or they'll either collapse under their own weight or constrain growth.
At 10 tutors, owner-operators can personally observe everyone monthly. Direct observation builds deep understanding of each tutor's strengths and development needs. Feedback happens organically through daily interaction. Documentation can be minimal—a spreadsheet suffices.
Around 20-25 tutors, personal observation becomes unsustainable. You need dedicated QA roles, likely part-time initially. Senior tutors can take observation responsibilities for a few hours weekly. Standardized rubrics become essential. Feedback must be documented systematically.
At 40-50 tutors, QA needs dedicated full-time resources and technological support. Roughly one QA manager per 40 tutors maintains reasonable observation coverage. Digital rubrics, automated scheduling, and dashboard reporting become necessities rather than nice-to-haves. Coaching programs need structure and scale.
Beyond 75 tutors, hierarchical QA structures emerge. Regional QA managers oversee location-specific observers. Peer observation supplements manager observation. Self-assessment becomes part of the process. Technology handles routine monitoring while humans focus on coaching and development.
Large-scale systems need sampling strategies. Not every tutor gets observed weekly. Statistical sampling ensures coverage while managing resources. Risk-based approaches flag tutors needing additional observation. Automation triggers alerts for score changes requiring intervention.
Multi-location centers face additional complexity. Observation standards must be calibrated across sites. Inter-rater reliability sessions ensure consistent scoring. Video observation enables remote quality monitoring. Regional differences in student populations might require rubric adaptations.
Scale changes feedback mechanisms too. One-on-one feedback works for 20 tutors. At 100, group coaching sessions address common issues more efficiently. Asynchronous feedback through recorded sessions scales better than trying to schedule individual meetings with everyone. Peer feedback circles distribute the coaching load.
Technology integration becomes critical at scale. Modern operational platforms can analyze session notes for quality indicators, flag concerning patterns in parent communication, track outcome metrics automatically, and generate observation schedules based on risk factors. This AI-assisted approach maintains quality oversight without proportional increases in headcount. Cultural considerations shift with scale too. Small centers maintain quality through relationships. Large centers need systematic accountability. The transition from relationship-based to system-based quality assurance is genuinely difficult for many growing organizations—it's worth anticipating rather than stumbling into it.
The hidden quality killers that rubrics miss and how to catch them anyway
Standard observation rubrics catch visible performance issues but miss subtle quality killers that erode retention over time.
Session prep happens outside observation windows. A tutor might perform brilliantly during observation but consistently arrive unprepared otherwise. Track proxy metrics: How often do they request materials last-minute? Do they review previous session notes? Are lesson plans completed before sessions start?
Communication between sessions significantly impacts perceived quality. Parents value tutors who send mid-week progress updates or share relevant resources. Monitor email response times, parent portal activity, and proactive communication frequency. These behaviors correlate strongly with retention but don't show up in session observations.
The handoff quality between sessions determines continuity. Does the tutor review previous notes before starting? Do they reference last week's work explicitly? Track whether students must re-explain their challenges each session—a sure sign of poor continuity that frustrates families more than they'll usually say directly.
Energy level consistency matters more than peak performance. A tutor who delivers amazing sessions when energized but phones it in when tired creates unpredictable experiences. Monitor performance variance, not just averages. High variance predicts retention issues regardless of mean scores.
Professional boundary management affects long-term relationships in ways that are hard to quantify. Tutors who become too friendly might lose academic authority. Those too distant might fail to build rapport. Watch for signs: sessions running over (poor boundaries), personal favors requested (too close), or overly formal language with long-term students (too distant).
Technology competence increasingly impacts quality. Tutors struggling with digital whiteboards, screen sharing, or learning platforms create friction parents won't tolerate long-term. Include tech competence in evaluations, especially for hybrid programs.
Schedule reliability predicts retention better than many centers expect. Track last-minute cancellations, chronic lateness, and schedule change requests. Parents tolerate mediocre teaching with perfect attendance over excellent teaching with unpredictable availability.
The match between tutor energy and student needs creates quality independent of rubric scores. High-energy tutors might overwhelm anxious students. Calm tutors might bore ADHD students. Track student-tutor personality fit through parent feedback and engagement metrics rather than assuming rubric scores capture everything. Cultural competence becomes critical in diverse communities too—tutors might score perfectly on rubrics while missing cultural cues that make families uncomfortable. Monitor retention patterns across demographic groups to identify potential blind spots.
Turning QA data into predictive models for intervention timing
Historical QA data reveals patterns that predict future problems. Smart centers use these patterns to intervene before issues impact retention.
The three-week score decline pattern signals burnout. When a previously high-performing tutor shows steady score decreases over three consecutive weeks, burnout is beginning. Intervention at week three prevents the week eight collapse that typically follows.
Engagement scores predict retention with a 4-6 week lag. A drop below 3.5 today manifests as schedule reductions next month. This leading indicator enables proactive parent communication and tutor coaching before families start pulling back.
New tutor trajectory analysis prevents early departures. Tutors whose scores don't reach 3.5 by week four rarely survive three months. Intensive support at week three might save them. Waiting until week eight often means it's too late.
Parent communication scores below 3.0 predict complaint escalation within two weeks in most cases. Immediate coaching on communication prevents time-consuming complaint resolution. A two-hour coaching session prevents ten hours of complaint management.
Variance in scores indicates external stressors affecting performance. When previously consistent tutors show erratic scores, personal issues are likely interfering. Proactive support conversations can prevent sudden resignations.
Cross-dimension correlation reveals skill gaps. Tutors with high academic scores but low engagement often have content knowledge but lack pedagogical training. Targeted coaching on instruction techniques usually fixes this imbalance faster than general development programs.
Session note quality predicts handoff problems. Tutors writing minimal notes consistently score lower on continuity metrics several weeks later. Note-taking training is often the simplest fix with the clearest payoff.
Observation frequency correlation shows optimal monitoring levels. Tutors observed less than twice monthly tend to show score degradation over time. Those observed more than weekly show performance anxiety. The sweet spot appears to be 3-4 observations monthly for maintaining quality without creating stress.
Build simple predictive rules from these patterns. If engagement drops 0.5 points and parent communication drops 0.3 points simultaneously, flag for immediate intervention. Combined indicators like this tend to predict a high percentage of retention issues before they become visible to families. That early visibility is where the real operational leverage sits.
Making the business case for QA investment to ownership and investors
QA programs require upfront investment and ongoing resources. Building a compelling business case means speaking the language of returns, not just quality improvement.
Frame QA as customer retention infrastructure, not overhead. Position it alongside CRM systems and marketing automation—essential tools for maintaining customer relationships. The QA investment protects the revenue base, not just the reputation.
Present comparative market data. Centers with formal QA tend to command meaningful premiums in M&A transactions. Quality documentation demonstrates operational maturity that buyers value. That can translate to substantial additional exit value relative to centers without documented systems.
Calculate fully-loaded turnover costs. Include recruiting, interviewing time, onboarding, training materials, and productivity ramp-up losses. Preventing several turnovers annually through QA can save significant money—often enough to justify much of the program cost.
Model expansion scenarios. QA systems enable rapid scaling through standardized quality maintenance. Opening new locations becomes less risky when quality systems ensure consistent delivery. This optionality has value beyond direct ROI.
Quantify competitive differentiation. School districts increasingly require quality documentation for partnership contracts. Corporate education benefits programs demand QA metrics. Access to these channels depends on systematic quality measurement.
Include risk mitigation value. One viral parent complaint about tutor quality can destroy reputation quickly. QA systems provide documentation defending against unfair accusations. It functions as operational insurance as much as anything else.
Project long-term value creation. Year one might show negative ROI as systems build. Year two breaks even. Years three through five generate strong returns through compound retention improvements. Present five-year NPV calculations where you can.
Address the "good enough" objection directly. Yes, you can run a tutoring center without formal QA. But "good enough" centers plateau at 65% retention and struggle to scale beyond 30 tutors. QA investment is often what unlocks the next growth stage. Connect QA metrics to valuation multiples too. Education businesses with documented quality systems often trade at higher revenue multiples than those without. On a $2 million revenue base, that difference in multiple can represent millions in additional enterprise value.
QA as competitive advantage in commoditized tutoring markets
Tutoring feels increasingly commoditized. Parents compare hourly rates. Students hop between providers. Margins compress as competition intensifies. Systematic quality assurance is one of the more reliable ways to break out of that trap.
Centers with mature QA systems retain families significantly longer than industry averages. They generate more referrals. They command premium pricing. They attract better tutors who value professional development. They win institutional contracts requiring quality documentation.
The investment required—roughly 2-3% of revenue—seems significant when budgets are tight. But the returns compound. Better retention reduces marketing costs. Higher quality enables price increases. Systematic improvement reduces expensive failures.
Start small if resources are limited. Begin with monthly observations of three struggling tutors. Document what you find. Create basic feedback loops. As retention improves, reinvest savings into expanding the program. Build gradually toward comprehensive coverage.
The centers thriving five years from now won't be those with the best marketing or lowest prices. They'll be those who systematically measure, improve, and document quality. In a market where parents have unlimited choices, consistent quality becomes the only sustainable differentiator.
Modern AI-powered operational platforms make QA implementation more accessible than it used to be. Automated scheduling, digital rubrics, integrated dashboards, and predictive analytics reduce administrative burden while improving insight quality. The same tools that felt enterprise-only a few years ago now fit small center budgets.
Your next step is simple: pick three tutors, create a basic rubric, observe one session each this week, document what you see, share specific feedback, and track whether behavior changes. This small start builds the muscle memory for systematic quality improvement.
The families quietly disappearing from your schedule aren't leaving because of price or convenience. They're leaving because quality slowly degraded while nobody was watching. A structured QA loop stops that drift, protects your reputation, and turns retention from a hope into something you can actually predict and manage.
The families quietly disappearing from your schedule aren't leaving because of price or convenience. They're leaving because quality slowly degraded while nobody was watching. A structured QA loop stops that drift, protects your reputation, and turns retention from a hope into something you can actually predict and manage.
Ready to streamline your tutoring operations?
Join 500+ tutors and centers using Tutoryly to save time, improve scheduling accuracy, and enhance student experiences.