


Most tutoring owners can tell you their monthly revenue off the top of their head. Ask them what their cash position will look like in March — after the January enrollment surge fades and before the spring exam prep rush kicks in — and you get a blank stare. That gap between knowing what you made and knowing what's coming is where tutoring businesses quietly get into trouble.
The frustrating part is that tutoring is one of the most forecastable service businesses out there. Enrollment follows the school calendar. Exam prep spikes on a schedule you can look up years in advance. Cohorts launch on dates you set yourself. And yet a lot of centers run their finances reactively, checking the bank balance and hoping payroll clears.
A real tutoring center cashflow forecast isn't a static spreadsheet you build once and forget. It's a living model with toggles — switches you flip to test "what if enrollment drops 15% after finals?" or "what if I hire two tutors before the fall cohort?" This article walks through how to build that model, how seasonal patterns actually move your cash, how failed payments distort the picture, and how to tie hiring and marketing spend to utilization instead of gut feeling.
Why tutoring cash is lumpy even when revenue looks flat
Your monthly recognized revenue and your monthly cash in the bank are almost never the same number, and the gap widens as you grow.
A family pays for a 12-session package up front in September. On your P&L, if you're doing it right, you recognize that revenue as sessions get delivered — roughly one session's worth at a time. But the cash all landed in September. So your bank account looks flush in early fall, then slowly drains as you deliver sessions you were already paid for, while your tutors get paid now for those same sessions.
Flip that around for centers running monthly subscriptions or payment plans, and you get the opposite problem: you deliver a full month of tutoring and collect the cash in pieces, some of it late, some of it never.
What shows up repeatedly with smaller centers is that owners build their whole mental model around "good months" and "slow months" based on how busy the schedule feels — not on when money actually moves. A packed December schedule can be a cash-negative month if most of those families paid back in October and your tutor payroll and rent are all due in December.
The fix isn't complicated conceptually. You need two layers in your model:
-
Accrual P&L — revenue matched to when sessions are delivered, so you can see true profitability by month
-
Cash flow — actual money in and out, timed to when it hits the account
If you only build one, build the cash flow. Profitability that you can't fund is just an interesting fact.
The seasonal shape of a tutoring year
Every region and subject mix is a little different, but the underlying rhythm is remarkably consistent. If you plot most centers' enrollment across twelve months, you get something like this:
Never miss another tutoring session.
Tutoryly helps you schedule, confirm, and manage every tutoring session efficiently.
- Unified session scheduling
- Automated student notifications
- Tutor calendar & availability management
No credit card required
| Period | Enrollment pattern | Cash reality |
|---|---|---|
| Late Aug – Sept | Big new-signup surge | Cash-rich (packages paid up front) |
| Oct – Nov | Steady, high utilization | Delivering paid sessions, payroll heavy |
| Dec | Attendance dips (holidays) | Cash tight, fixed costs unchanged |
| Jan | Second signup wave (new semester) | Cash-rich again |
| Feb – Apr | Exam prep ramp (SAT/ACT/APs/finals) | Peak revenue, peak tutor hours |
| May – June | Post-exam cliff | Revenue drops fast, costs lag |
| July – Aug | Summer programs / slow | Highly variable by center |
The two most dangerous months in that table are December and May–June, for the same underlying reason: your costs don't move as fast as your revenue does. Tutors are still on the schedule, rent is rent, but families have either checked out for the holidays or wrapped up their exam goals and paused.
The post-exam cliff in late spring is the single most underestimated cash event in tutoring. Centers that ran February through April at full utilization — often hiring extra help to cover the load — walk into May with the same headcount and half the demand. If you didn't plan the ramp-down, you're paying for capacity you can't fill for six to eight weeks.
Building seasonal toggles into the model
The whole point of toggles is to stop rebuilding the spreadsheet every time reality shifts. Instead of hardcoding "40 active students in October," you build the model so a handful of input cells drive everything downstream.
-
Base enrollment by month — your realistic student count per month, keyed to the seasonal shape above
-
Enrollment sensitivity toggle — a single percentage you can dial (say, -15%) to stress-test a weak season across every month at once
-
Package mix toggle — what share of families are on up-front packages vs. monthly plans, since this drives when cash lands
-
Exam-cycle multiplier — an extra bump applied only to Feb–Apr for test prep hours
-
Cohort launch inputs — start date, cohort size, and price, entered separately so you can model launching a new group without touching your recurring base
When those inputs feed your revenue and cash rows through formulas, you can answer real questions in seconds: If my spring cohort fills at 70% instead of 100%, can I still make July payroll? That's the question that actually matters, and a static spreadsheet can't answer it without an hour of manual edits.
Cohort launches: the cash event people model wrong
Cohort-based programs — a 10-week SAT bootcamp, a summer reading intensive — behave very differently from ongoing 1:1 tutoring, and mixing them into one revenue line hides the risk.
A cohort has a fixed cost structure the moment you commit to running it: you've booked a tutor's time, maybe reserved a room, and spent on marketing to fill seats. Those costs are largely sunk before the first session. Your break-even isn't a monthly average — it's a specific seat count.
A typical example: say you're launching a 10-week group program.
-
Tutor cost
~$45/hour × 2 hours/week × 10 weeks = $900
-
Marketing to fill it
~$600–$900
-
Materials and misc
~$150
-
Total commitment
roughly $1,650–$1,950
If you price the program at $650 per student, you need about three enrolled students just to break even, and everything past that is mostly margin because your costs are fixed regardless of whether you seat 3 or 8.
The mistake is pretty common: owners look at a full cohort, see the total revenue, and assume the next cohort will fill the same way — so they pre-commit the tutor and marketing spend. When the second cohort only half-fills, they've already spent the fixed costs and are now underwater on that specific program while it drags down the whole month.
Your forecast should treat each cohort as its own mini P&L with a break-even seat line, then roll the result up into the master model. That way a soft cohort shows up as a contained loss you can see coming — not a mystery dip in your overall numbers.
What failed payments actually do to the forecast
Most owners treat failed payments as an annoyance — a card that expired, a family that'll pay next week. In a cashflow model, they're more corrosive than that: they turn forecasted revenue into maybe revenue, and they tend to cluster at the worst possible times.
Failed payments spike right when families are already stretched — early January after holiday spending, start of summer when routines change. Your failure rate isn't evenly spread; it hits hardest in the exact months your cash is already tight.
Run the math on a modest failure rate. Say you're billing $18,000 a month in recurring plans and your involuntary failure rate runs around 6%. That's roughly $1,080 a month that doesn't arrive on time — and a meaningful slice of it never arrives at all if you're not actively chasing it. Over a year, with seasonal spikes, you're easily looking at a few thousand dollars quietly evaporating.
For forecasting purposes, build a collection haircut into your model rather than assuming 100% of billed revenue converts to cash. Two rows matter:
-
Billed revenue — what you invoiced
-
Collected cash — billed minus your realistic failure/delinquency rate, timed to when recovery actually happens
If your recovery process is tight, that haircut might be 1–2%. If you're not actively working failed payments, it can run 5–8%. Knowing which one applies to your operation is the difference between a forecast you can trust and one that's quietly optimistic.
The key forecasting insight here: failed payments aren't just a billing problem, they're a cash-timing problem. A payment that comes in three weeks late still counts as revenue eventually, but it might mean you can't cover payroll on the 15th. Model the timing, not just the total.
Tying hiring and marketing spend to utilization triggers
This is where a forecast stops being a passive report and starts driving decisions.
The two biggest discretionary levers in a tutoring center are when you hire and how much you spend on marketing. Owners tend to pull both based on feeling — hiring when they're stressed and slammed, cutting marketing when cash feels tight. Both instincts are frequently backwards.
The metric that should govern both is utilization — the percentage of your available tutor hours that are actually booked and delivered. Not scheduled. Delivered.
The utilization triggers that matter
-
Above ~85% utilization for two consecutive weeks → hiring trigger. You're turning away families or overloading tutors, and quality is about to slip. Recruit before the next enrollment wave, not during it.
-
Below ~60% utilization → marketing trigger. You have paid-for capacity sitting idle. Every empty slot is margin left on the table, and this is exactly when cutting marketing makes things worse.
-
65–85% → the healthy zone. Hold steady and watch the trend.
The reason to build these as triggers inside the forecast is timing. Hiring has a lag — you need weeks to recruit, vet, and ramp a new tutor before they're producing billable hours rather than just costing you money. If your forecast shows utilization crossing 85% in September because of the fall surge, the model should be telling you to start hiring in July.
Start the hiring timeline several weeks before forecasted peaks to avoid last-minute scrambling.
Same logic runs in reverse for the post-exam cliff. If your model shows utilization falling off in May, you don't want to have just hired three people in April. The forecast surfaces that collision before it becomes a payroll problem.
How the pieces connect month to month
``
Enrollment toggle
      ↓
Projected student-hours for the month
      ↓
÷ Available tutor-hours
      ↓
Projected utilization %
      ↓
    /       \
>85%        <60%
Hire flag   Marketing flag
    \       /
  Cost added to future months
      ↓
Cash row — solvency check through slow months
``
-
Your enrollment toggle feeds projected student-hours for the month.
-
Divide by your available tutor-hours to get projected utilization.
-
If utilization crosses the upper trigger, the model flags a hire — and adds that tutor's cost (with a ramp delay before they're fully billable) to future months.
-
If utilization drops below the lower trigger, the model flags increased marketing spend — and you can toggle a corresponding enrollment lift to test whether the spend pays back.
-
Every one of those changes flows into the cash row, so you can immediately see whether the decision keeps you solvent through the slow months.
That loop — enrollment → utilization → spend decision → cash impact — is the actual engine of the forecast. Everything else is just inputs.
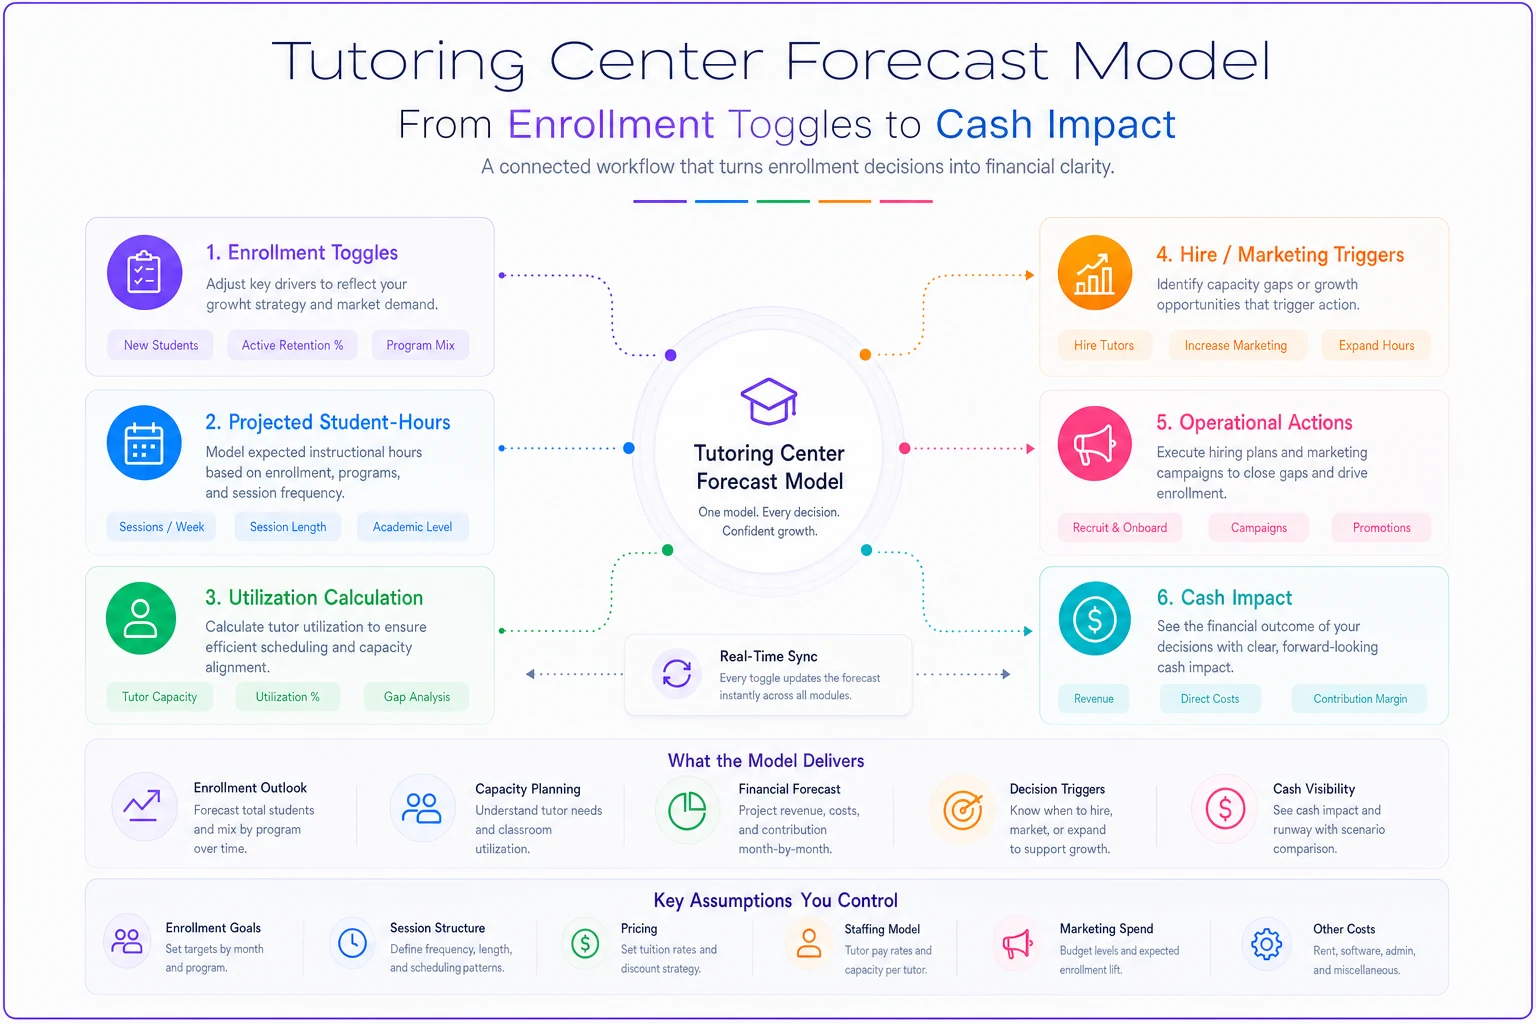
This diagram shows the flow from inputs to triggers so you can see where timing mismatches create cash stress.
When this level of modeling makes sense (and when it doesn't)
Not every tutoring operation needs a toggle-driven forecast.
When it's worth building: Once you're past roughly 30–40 active students, running multiple tutors, or mixing 1:1 with cohort programs, the interactions between seasonality, payroll, and payment timing get too complex to hold in your head. It also becomes essential the moment you start pre-committing money — hiring ahead of demand or spending on cohort marketing before seats are sold.
When it's overkill: A solo tutor with 12 steady students and month-to-month billing doesn't need seasonal toggles. Your cash pattern is stable enough that a simple monthly tracker does the job.
Who should be careful: Owners who build a model and then never update the inputs. A forecast is only as good as your discipline in feeding it real numbers. If you're not reconciling projected vs. actual at least monthly, a fancier model won't save you — it'll just give you more confident wrong answers.
A real scenario: the spring cliff that almost took out a center
Consider a mid-sized center — around 55 active students, a mix of 1:1 and small-group test prep, running roughly $22k–$25k in monthly revenue during peak.
Their problem was textbook. February through April was strong: exam prep demand pushed utilization above 90%, so in March they hired two new tutors to keep up. Reasonable call in the moment. The issue was they had no forecast connecting that hire to what came next.
May arrived and the post-exam cliff hit. Utilization dropped into the low 50s almost overnight as test prep families wrapped up. Now they had two extra tutors on payroll, a fixed rent bill, and a failed-payment spike from families going into summer mode. June cash came in roughly $4k–$5k short of what they needed to cover payroll and rent comfortably. They floated it on a credit line — expensive and stressful.
The fix wasn't dramatic. They built a cash model with a seasonal enrollment toggle and utilization triggers. The next spring, the same demand spike showed up — but this time the forecast showed the May cliff clearly and flagged that permanent hires in March would collide with it. They staffed the exam season with a short-term contract tutor and some existing staff on extra hours instead. When demand fell off, the cost fell off with it.
Same revenue peak, but they cleared the summer without touching the credit line. Nothing about their teaching changed — just the timing of their money decisions.
Bringing it together
The pieces here don't work in isolation. Your seasonal toggles are what make utilization projections meaningful. Your utilization triggers are what turn those projections into hiring and marketing decisions. And your failed-payment haircut is what keeps the whole thing honest about how much cash actually shows up versus how much you billed.
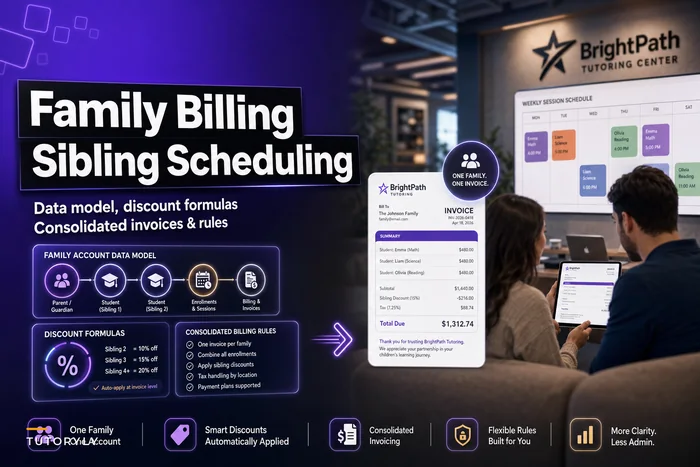
Two other systems feed directly into this and are worth having sorted first. Your pricing and package structure determines the shape of your incoming cash — up-front packages versus monthly plans change your entire cash-timing picture — which is why it's worth getting your pricing and packaging system right before you model cash. And if you serve families with multiple kids, your family account and consolidated billing setup affects both your revenue lines and your failed-payment exposure, so those numbers need to flow into the same forecast.
Modern operations software can automate a lot of the data that feeds this — pulling real utilization from your schedule, flagging failed payments as they happen, tracking actual delivered sessions against billed ones — so the forecast stays anchored to real numbers instead of your memory. But the tooling is secondary. The thing that actually changes outcomes is having a model that connects enrollment, capacity, and cash into one view, and then looking at it before you make the big spending calls.
The centers that get squeezed every December and every June aren't worse at teaching. They're just making decisions without knowing what's coming. Build the model, wire in the toggles, watch the triggers, and the seasonal swings stop being emergencies and start being things you planned around months ago.
Ready to streamline your tutoring operations?
Join 500+ tutors and centers using Tutoryly to save time, improve scheduling accuracy, and enhance student experiences.